Fig. A.3
Download original image
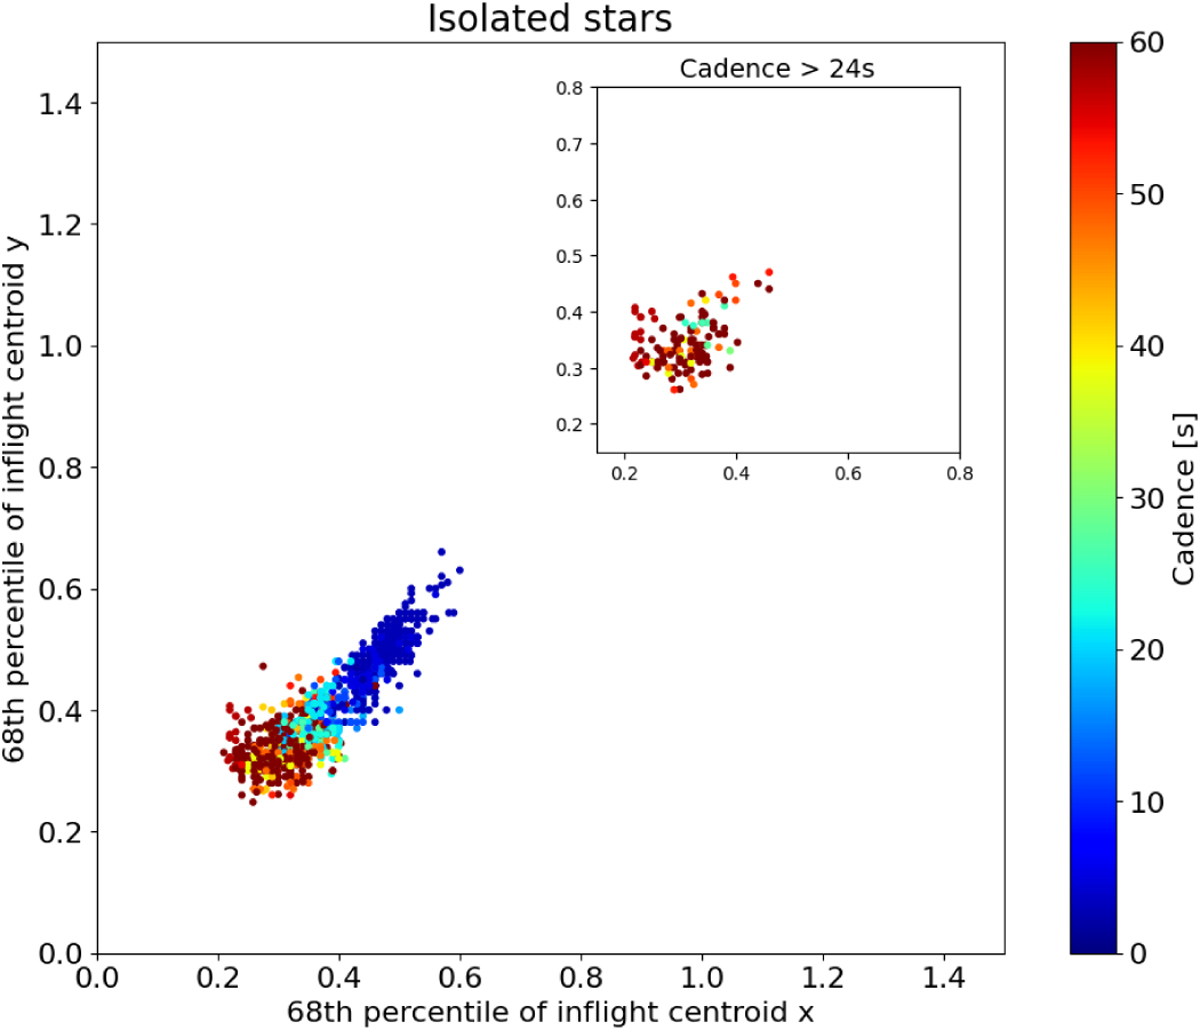
PITL. Shown is the spread of centroid position measured by the IFSW and quantified using the 1-sigma 68th percentile of the distribution for isolated stars only. The colour code shows the image cadence. The inset shows a subset having only cadences > 24 seconds where no imagettes are created, and no image stacking happens. The blue points represent high cadence data, and they sample the high-frequency jitter component that appears to have an amplitude of about 0.5 to 0.6 arcsec-onds.
Current usage metrics show cumulative count of Article Views (full-text article views including HTML views, PDF and ePub downloads, according to the available data) and Abstracts Views on Vision4Press platform.
Data correspond to usage on the plateform after 2015. The current usage metrics is available 48-96 hours after online publication and is updated daily on week days.
Initial download of the metrics may take a while.