Fig. 3
Download original image
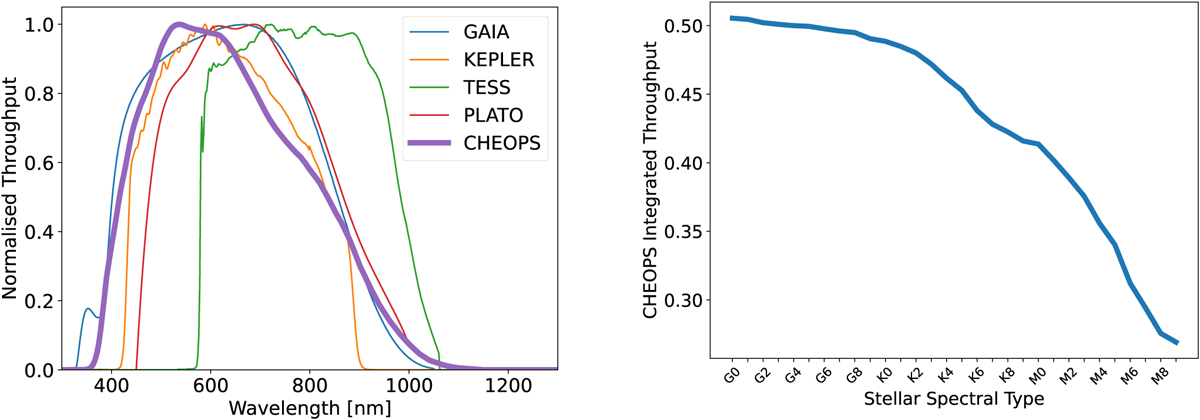
CHEOPS throughput. Left: normalised CHEOPS throughput as a function of wavelength. For comparison, normalised Gaia, Kepler, TESS, and PLATO throughput are also plotted. Note the similarity between CHEOPS and Gaίa throughput. Right: CHEOPS integrated throughput as a function of the star’s spectral type using PHOENIX model for the SED (Hauschildt et al. 1999a,b). This represents the fraction of all incident photons in the 330 nm to 1100 nm wavelength range converted into photoelectrons.
Current usage metrics show cumulative count of Article Views (full-text article views including HTML views, PDF and ePub downloads, according to the available data) and Abstracts Views on Vision4Press platform.
Data correspond to usage on the plateform after 2015. The current usage metrics is available 48-96 hours after online publication and is updated daily on week days.
Initial download of the metrics may take a while.