Fig. 26
Download original image
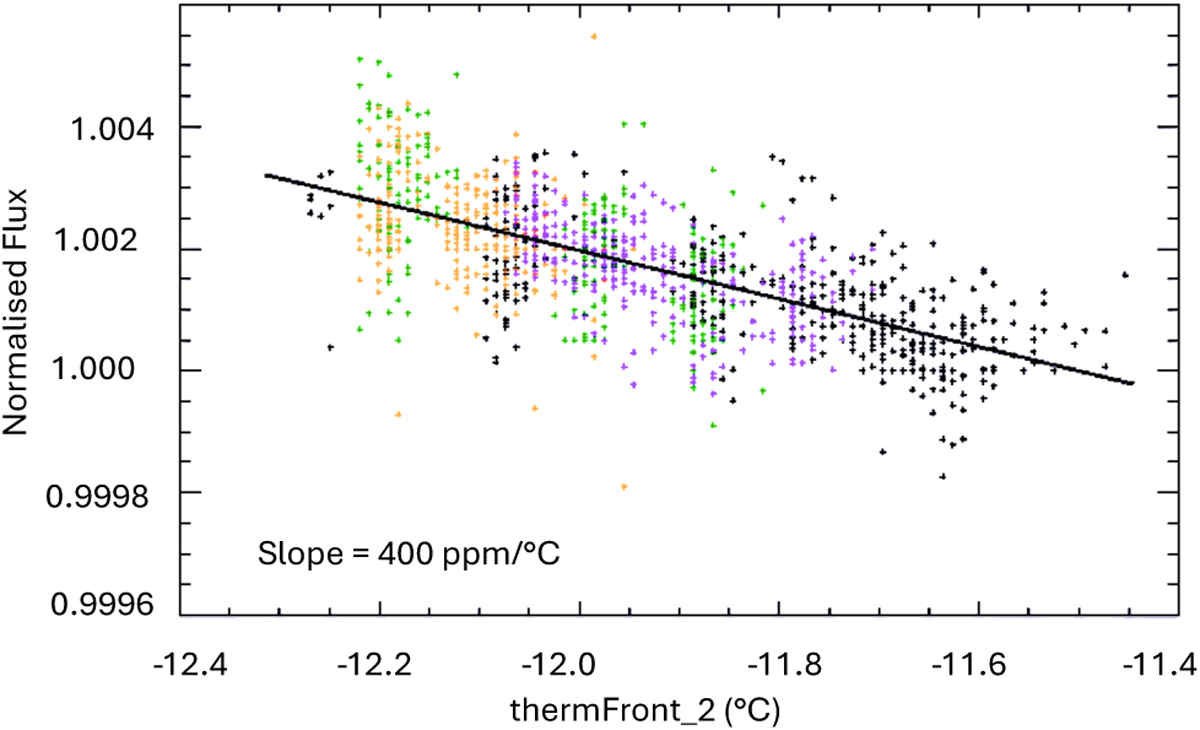
Linear dependence between the telescope tube temperature and the measured flux. Each colour corresponds to a visit with a ramp. These four visits span over the temperature range measured by thermFront_2 (x-axis). The y-axis is the normalised flux measured in a photometric aperture of R = 40 px. The flux measured in the aperture decreases linearly as the temperature increases.
Current usage metrics show cumulative count of Article Views (full-text article views including HTML views, PDF and ePub downloads, according to the available data) and Abstracts Views on Vision4Press platform.
Data correspond to usage on the plateform after 2015. The current usage metrics is available 48-96 hours after online publication and is updated daily on week days.
Initial download of the metrics may take a while.