Fig. 19
Download original image
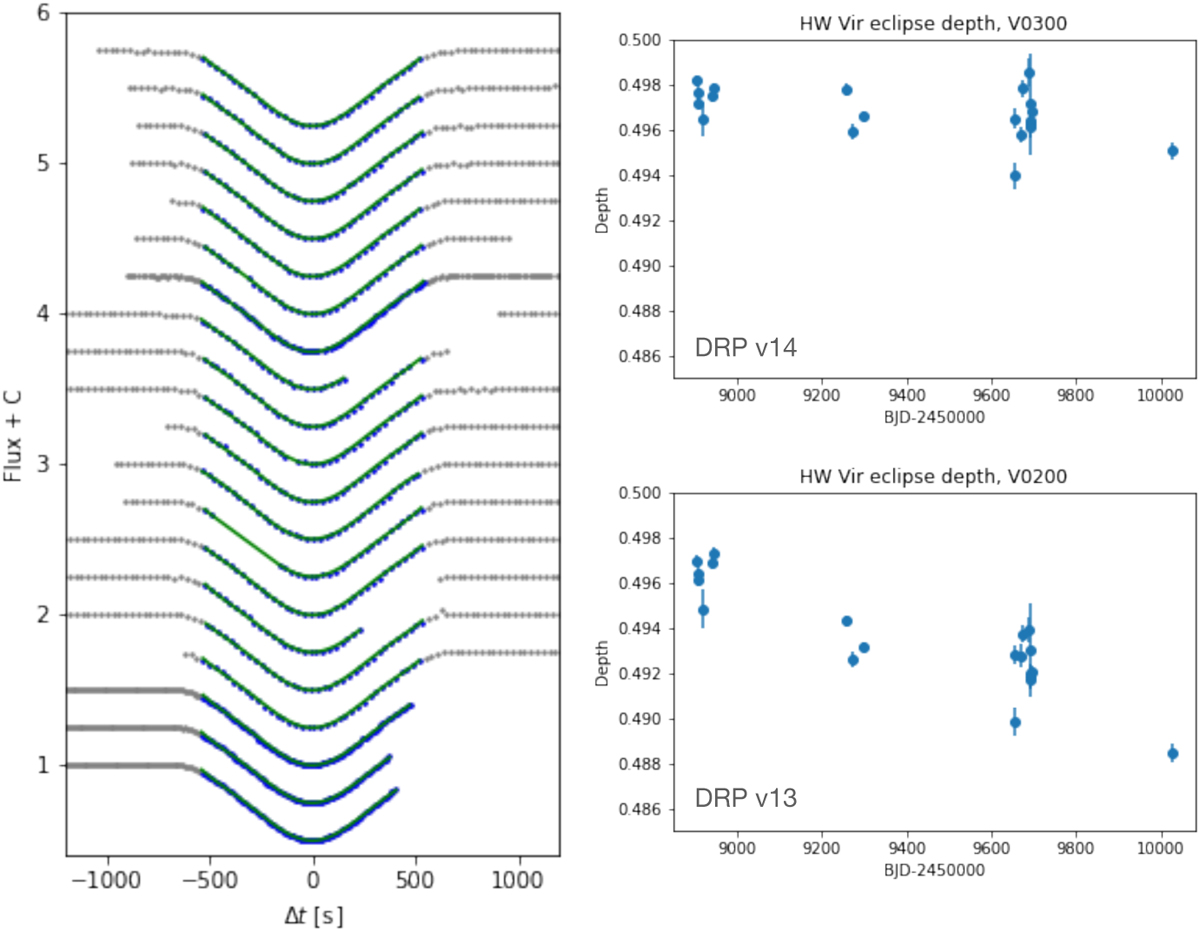
HW Vir eclipses. Left: light curves of all eclipses acquired to check the timing precision of CHEOPS. These light curves can be used to measure the eclipse depth at different epochs. Bottom right: measured eclipse depth through the years. Data processed with DRP vl3. Note the decrease in the eclipse depth (2%) as the instrument ages. The hot pixels increase the flux in the aperture, so the eclipse is slightly diluted. Top right: same data processed with DRP vl4 where the dark current of the hot pixels is subtracted. The eclipse depth is stable through the years with a dispersion lower than 0.8%.
Current usage metrics show cumulative count of Article Views (full-text article views including HTML views, PDF and ePub downloads, according to the available data) and Abstracts Views on Vision4Press platform.
Data correspond to usage on the plateform after 2015. The current usage metrics is available 48-96 hours after online publication and is updated daily on week days.
Initial download of the metrics may take a while.