Open Access
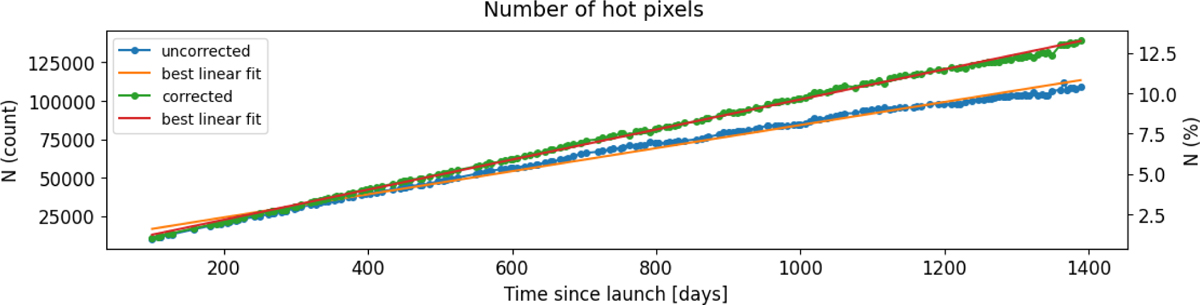
Fig. 14
Download original image
Generation rate of hot pixels. Considering the whole mission timeline, it is around 98 px day−1, while at the beginning of the mission, the rate was approximately 100 px day−1. Blue dots represent the raw data with background correction and green dots correspond to corrected data accounting for CTI and statistical effects.
Current usage metrics show cumulative count of Article Views (full-text article views including HTML views, PDF and ePub downloads, according to the available data) and Abstracts Views on Vision4Press platform.
Data correspond to usage on the plateform after 2015. The current usage metrics is available 48-96 hours after online publication and is updated daily on week days.
Initial download of the metrics may take a while.