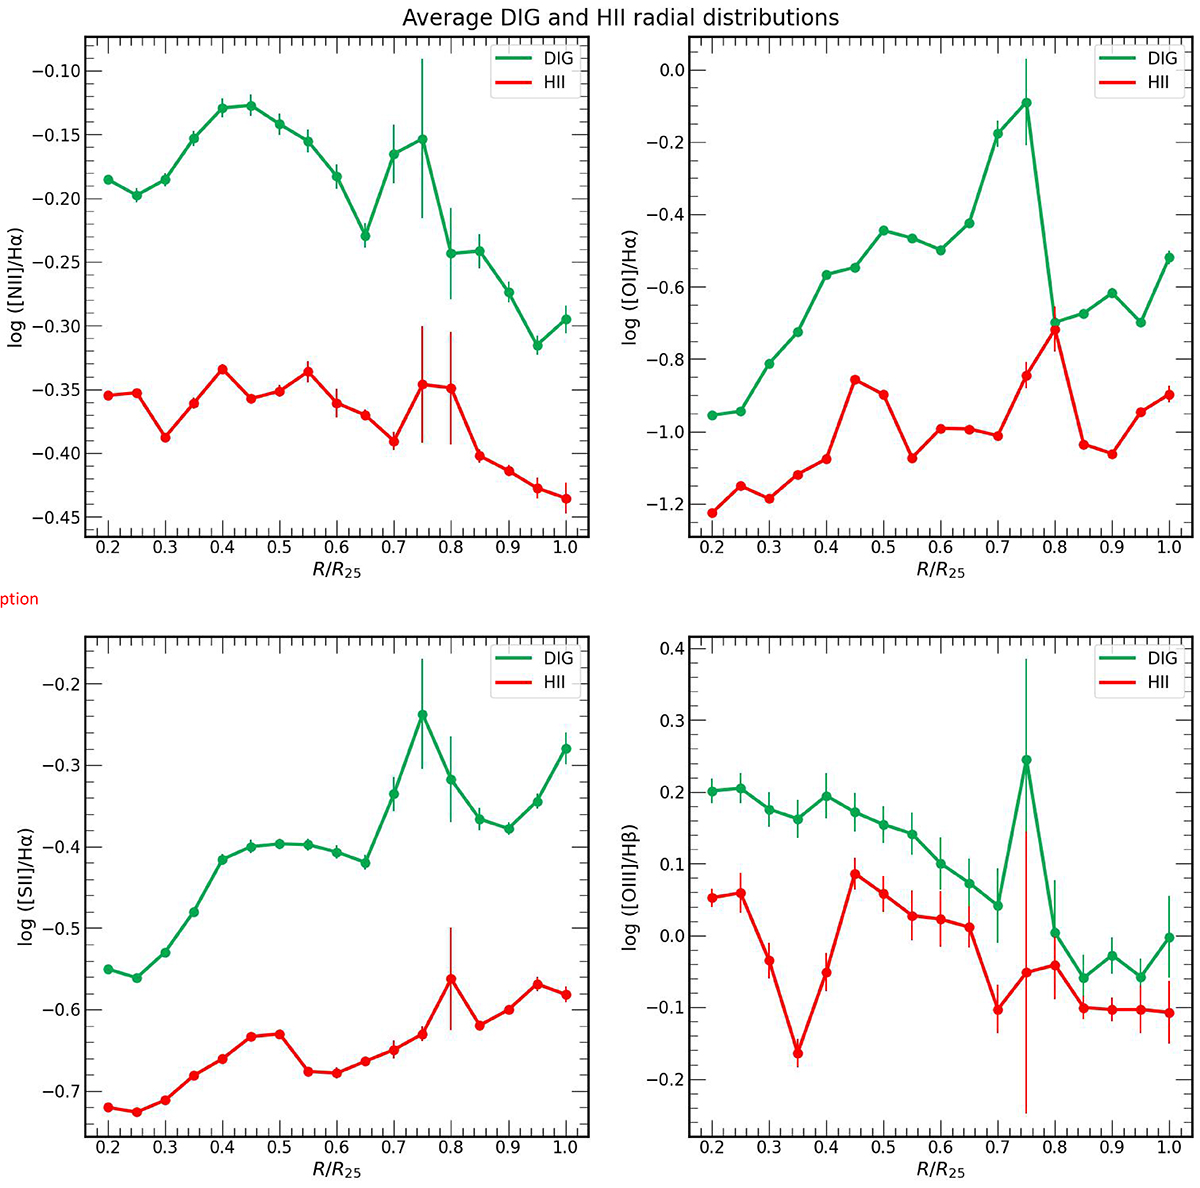
Fig. 8.
Download original image
Radial distribution of the [S II]/Hα ratio of the DIG bins (green), and H II regions according to our definition (red), obtained as the ratio of the mean values of the respective fluxes within a ring of width 0.05R25 with a step of 0.05R25 from 0.2R25 to R25. We are only considering those bins whose relative error in [S II] and Hα lines are lower than 40%. To avoid the strong AGN emissions, we start all the distributions from 0.2R25. In general we see a tendency to increase the ratio as we move to outer regions of the galaxy. Besides, the ratio is in all cases higher in DIG regions, as we expected from the literature (Haffner et al. 2009).
Current usage metrics show cumulative count of Article Views (full-text article views including HTML views, PDF and ePub downloads, according to the available data) and Abstracts Views on Vision4Press platform.
Data correspond to usage on the plateform after 2015. The current usage metrics is available 48-96 hours after online publication and is updated daily on week days.
Initial download of the metrics may take a while.