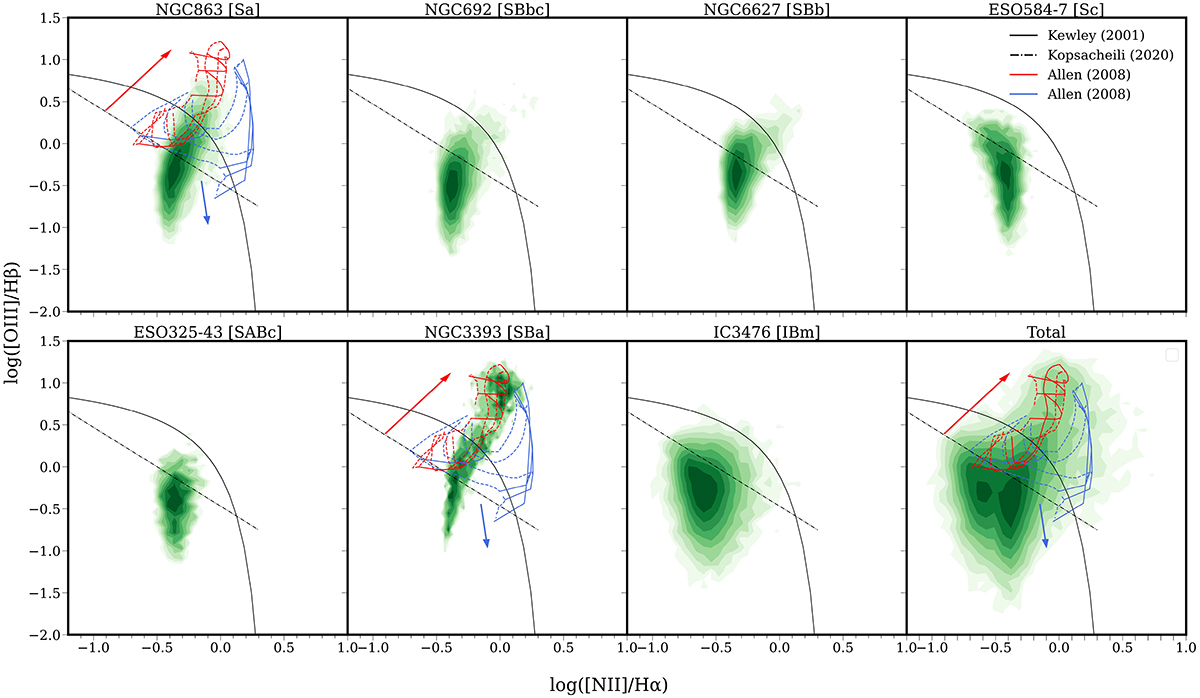
Fig. 7.
Download original image
BPT diagnosis of the sample for the DIG bins that verifies that the relative errors of [O III] line bins are below 40% and its S/N above 3. The last panel displays the seven prior panels together. The central parts of NGC863, NGC3393, and NGC692 were excluded in all panels due to their strong AGN emissions. Each contour encloses the 10% of the points, with every point a single bin. Black lines are given by Kewley et al. (2001) (solid) for the classic H II regions photoionisation and AGN demarcations. The dashed-dot line depicts one of the 2D diagnostics developed by Kopsacheili et al. (2020) for the separation of shock excited (e.g. supernova remnants) from photoionised regions (e.g. H II regions). Coloured lines represent the models of photoionisation by fast shocks from Allen et al. (2008). The blue and red models illustrate photoionisation where only front shocks occur and when pre-ionisation by a precursor is taken into account. The solid model curves plotted represents shocks winds of 200, 400, 500 and 1000 km s−1, and dashed model curves represents magnetic field intensities of 0.0001, 1.0, 5.0 and 10. Red and blue arrows represent the direction of increasing wind velocity in each model.
Current usage metrics show cumulative count of Article Views (full-text article views including HTML views, PDF and ePub downloads, according to the available data) and Abstracts Views on Vision4Press platform.
Data correspond to usage on the plateform after 2015. The current usage metrics is available 48-96 hours after online publication and is updated daily on week days.
Initial download of the metrics may take a while.