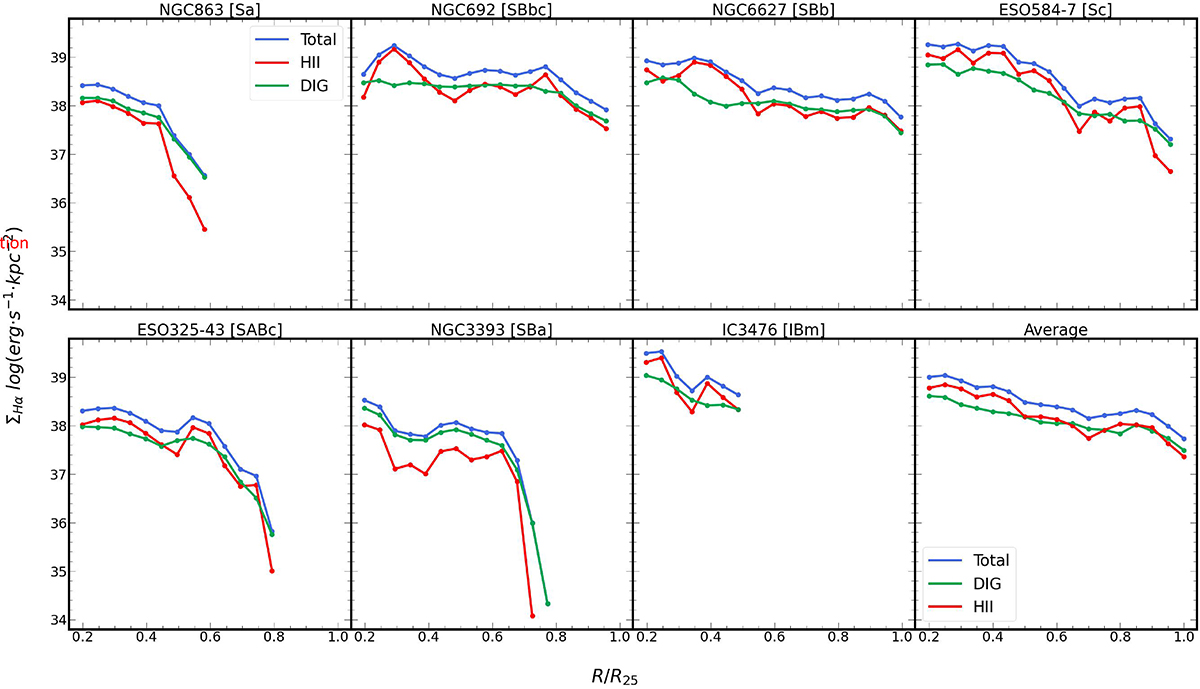
Fig. 6.
Download original image
Radial distribution of ΣHα for each galaxy, obtained by measuring the surface brightness of a series of de-projected annulus centred at the nucleus of each galaxy with a width of 0.05R25. The distributions are performed for the entire galaxy (blue), the lower DIG limit (green) and H II regions (red). The last panel represent the mean distributions for the sample.
Current usage metrics show cumulative count of Article Views (full-text article views including HTML views, PDF and ePub downloads, according to the available data) and Abstracts Views on Vision4Press platform.
Data correspond to usage on the plateform after 2015. The current usage metrics is available 48-96 hours after online publication and is updated daily on week days.
Initial download of the metrics may take a while.