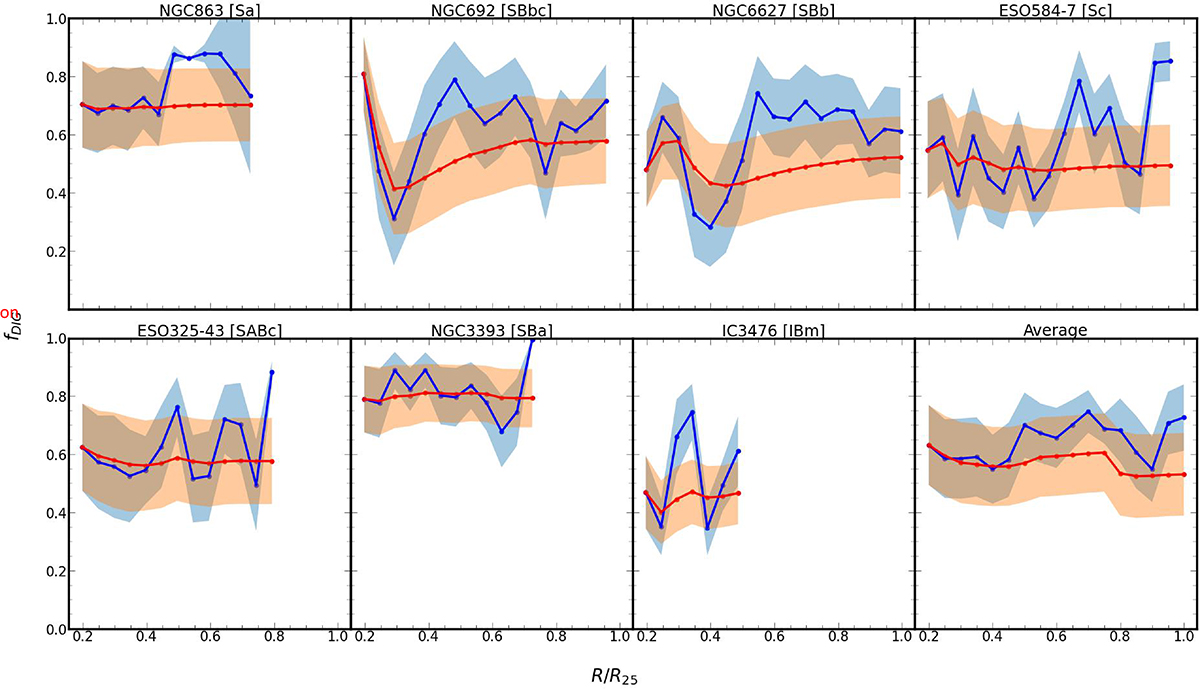
Fig. 5.
Download original image
Distribution of the DIG fraction (f(Hα)DIG/f(Hα)total) for each galaxy of the sample. Red area represents the cumulative distribution between the upper and lower DIG limits, with a step of 0.05R25, being the solid red lined the mean value. Blue area is the radial distribution of the DIG obtained integrating the flux between rings of width 0.05R25 and with a step of 0.05R25, being the solid blue lined the mean value. R25 is the isophote at the blue brightness of 25 mag arcsec−2. This parameter is obtained from Hyperleda database.
Current usage metrics show cumulative count of Article Views (full-text article views including HTML views, PDF and ePub downloads, according to the available data) and Abstracts Views on Vision4Press platform.
Data correspond to usage on the plateform after 2015. The current usage metrics is available 48-96 hours after online publication and is updated daily on week days.
Initial download of the metrics may take a while.