Fig. 3.
Download original image
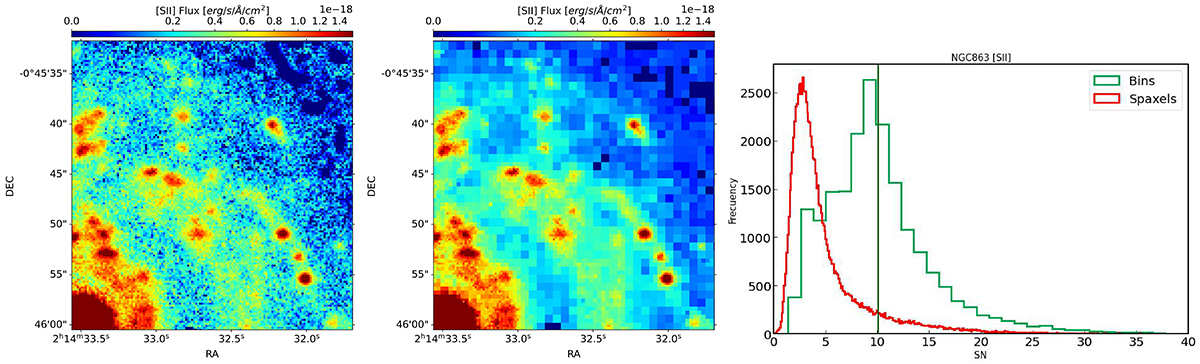
NGC863. Left panel: [S II] emission line map obtained from the Gaussian fitting of the [S II] line from the nebular gas cube spaxel-by-spaxel. The nebular cube was obtained as the difference between the observed cube and stellar cube as described in Appendix A. Central panel: binned [S II] emission line map, from the binned nebular gas cube, after performing an adaptive binning with target S/N([S II]) = 10 to the observed cube, as described. Both panels are close-up of the same region than Fig. 2. Right panel: distributions of S/N of the [S II] line for NGC863, calculated with the Eq. (1). Red distribution corresponds to the S/N([S II]) measured in the observed cube, namely, the S/N([S II]) of the spaxels. Green distribution corresponds to the S/N([S II]) measured in the binned cube, namely, the S/N([S II]) of the bins. The vertical dark green line marks the mean value of the S/N([[S II]]) of the bins, showing that the adaptive binning technique fulfils the goal of reaching a target S/N([S II]) = 10, on average.
Current usage metrics show cumulative count of Article Views (full-text article views including HTML views, PDF and ePub downloads, according to the available data) and Abstracts Views on Vision4Press platform.
Data correspond to usage on the plateform after 2015. The current usage metrics is available 48-96 hours after online publication and is updated daily on week days.
Initial download of the metrics may take a while.