Open Access
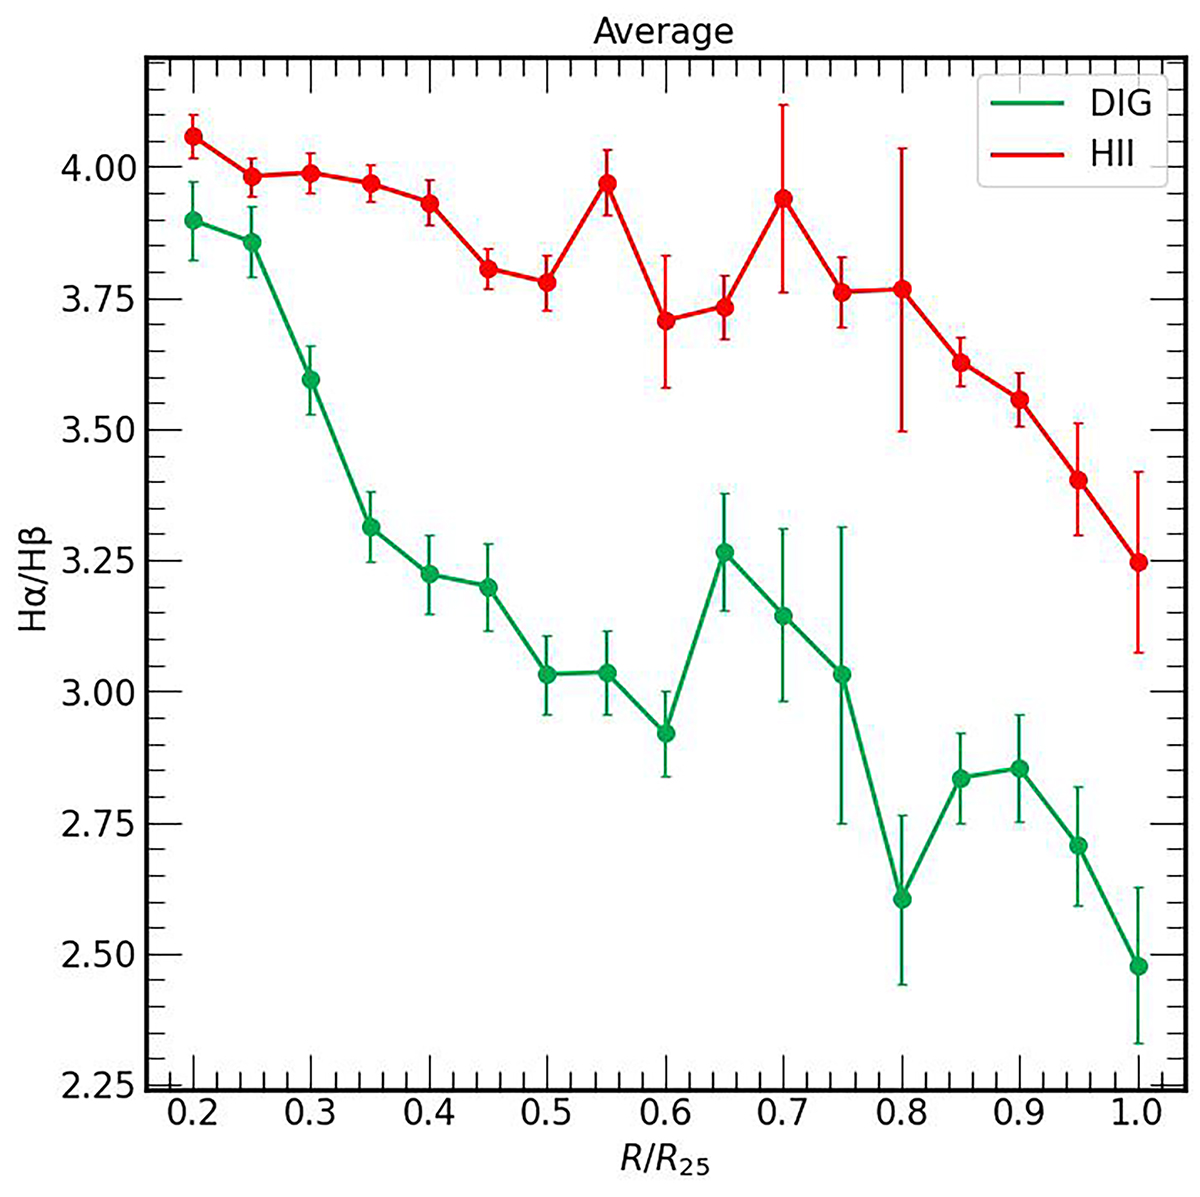
Fig. 12.
Download original image
Mean radial Hα/Hβ ratio distribution of the sample. The distributions are obtained as in Fig. 8. Red represent the distribution for the H II regions bins, and green for the DIG bins. Both distributions decrease radially, on average, but the extinction is always lower in the DIG regime.
Current usage metrics show cumulative count of Article Views (full-text article views including HTML views, PDF and ePub downloads, according to the available data) and Abstracts Views on Vision4Press platform.
Data correspond to usage on the plateform after 2015. The current usage metrics is available 48-96 hours after online publication and is updated daily on week days.
Initial download of the metrics may take a while.