Fig. 10.
Download original image
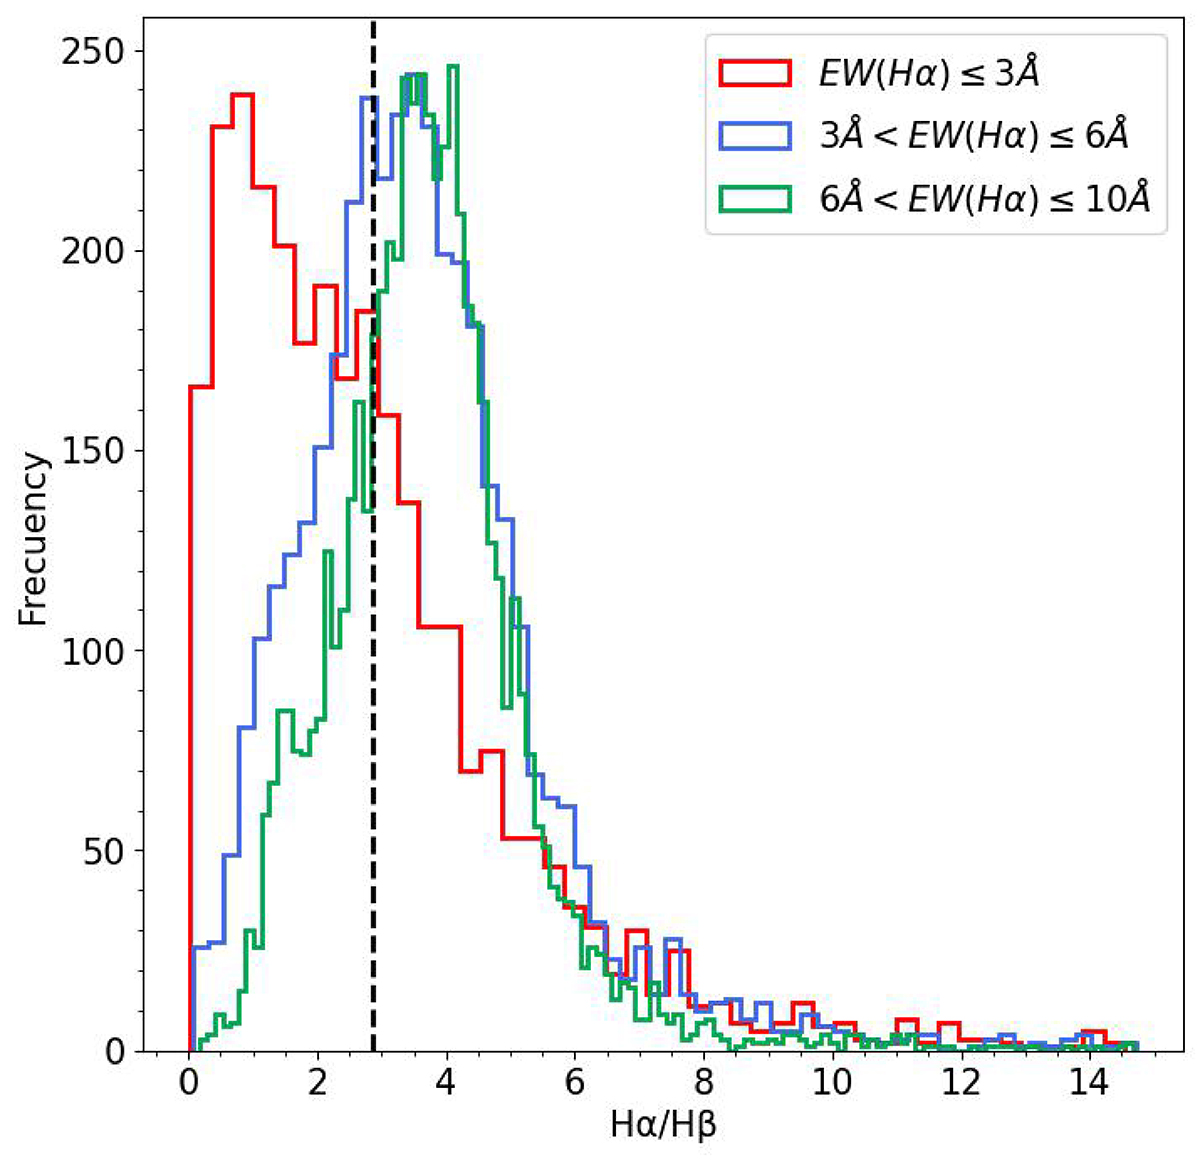
Distribution of Hα/Hβ ratio for three different EWHα regimes. Each distribution represent the Hα/Hβ flux ratio for all bins between 6 Å < EWHα ≤ 10 Å (green), 3 Å < EWHα ≤6 Å (blue), and EWHα ≤3 Å (red), for the seven binned galaxies listed in Table 1. Black vertical dashed line presents the theoretical ratio of Hα/Hβ = 2.87 (Osterbrock & Ferland 2006). We can see that a substantial part of the bins with EWHα ≤ 3 Å shows a non-physical ratio (< 2.87).
Current usage metrics show cumulative count of Article Views (full-text article views including HTML views, PDF and ePub downloads, according to the available data) and Abstracts Views on Vision4Press platform.
Data correspond to usage on the plateform after 2015. The current usage metrics is available 48-96 hours after online publication and is updated daily on week days.
Initial download of the metrics may take a while.