Fig. 4.
Download original image
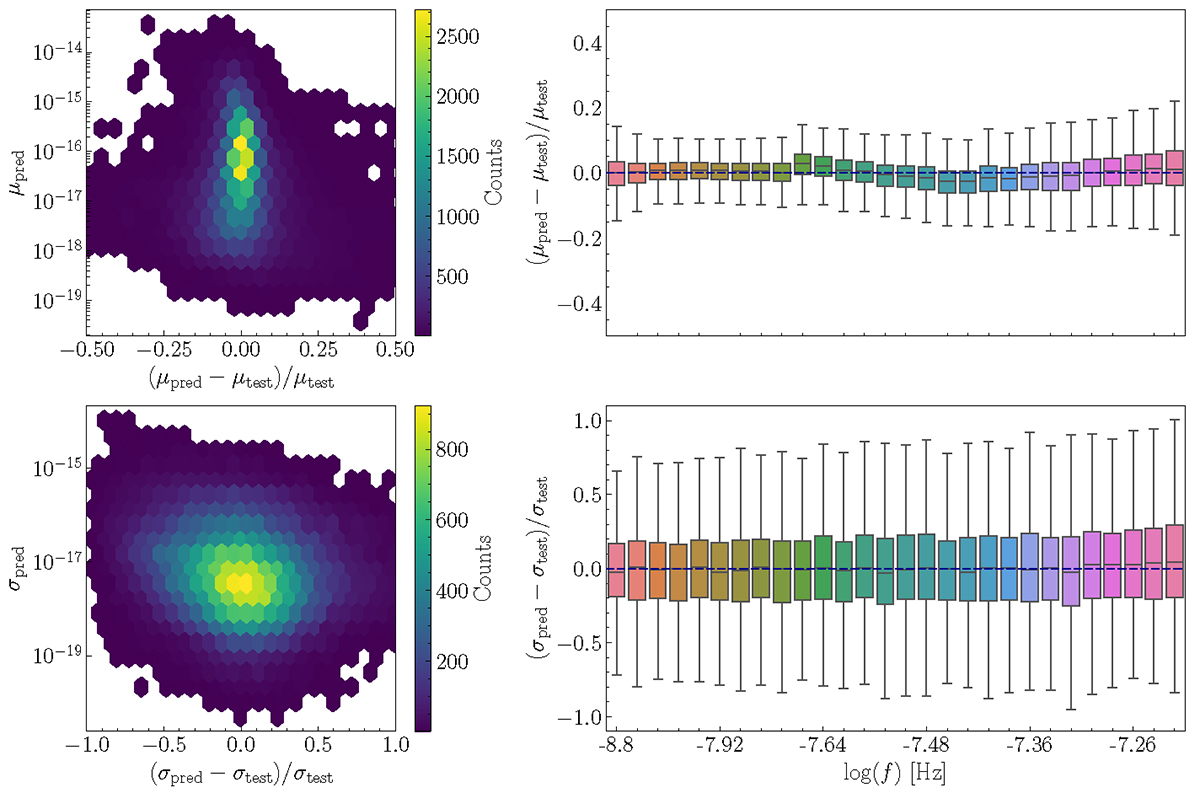
Performance of our algorithm in the explored parameter space. Left panels: density contours of the relative error (i.e., the difference between the predicted value and the true value, which is the value of the test set) divided by the true value, as a function of the predicted quantity, either mean μpred (top) or standard deviation σpred (bottom). The colour scale denotes the number counts within each bin where the error was computed. Right panels: relative error on mean (top) and standard deviation (bottom) as a function of frequency. The box plot highlights the median enclosed by the 25th and 75th percentiles of the error distribution at each frequency, with the error bars enclosing the full spread of values. The mean and standard deviation are computed in logscale. The blue dashed line marks the zero relative error.
Current usage metrics show cumulative count of Article Views (full-text article views including HTML views, PDF and ePub downloads, according to the available data) and Abstracts Views on Vision4Press platform.
Data correspond to usage on the plateform after 2015. The current usage metrics is available 48-96 hours after online publication and is updated daily on week days.
Initial download of the metrics may take a while.