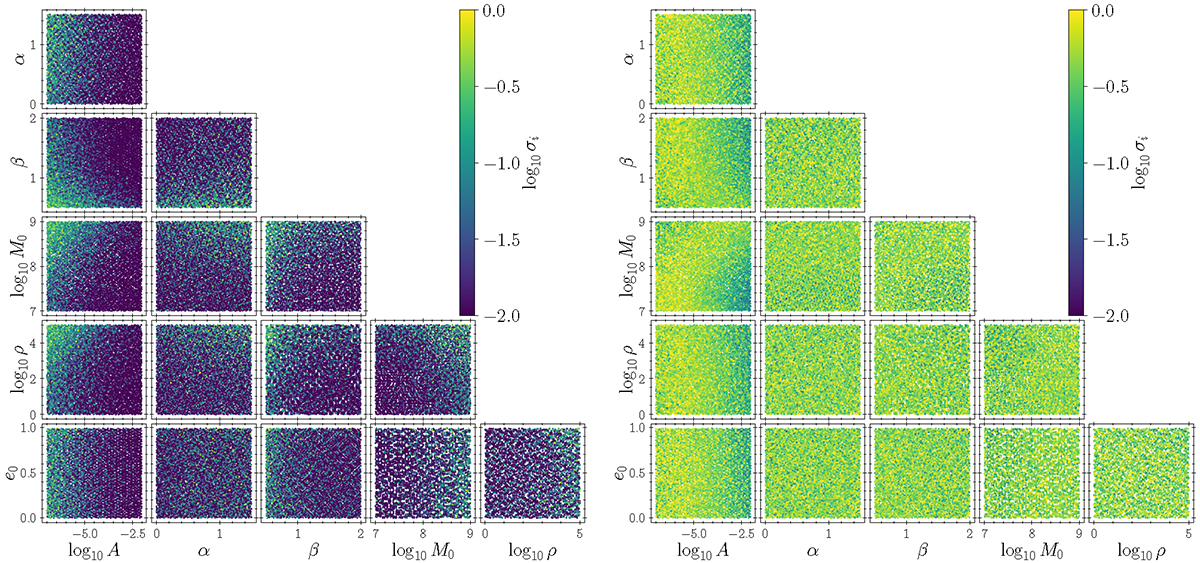
Fig. 3.
Download original image
Corner plot showing the dependence of GWB variance (colour scale) on the model parameters, considering the lowest (left) and highest (right) frequency bin. As can be inferred from the colour scale (more evident in the left panel), lower values of α and β combined with a high cutoff mass M0 are linked to a larger scatter, which is caused by the increased probability of having more massive binaries that can produce spikes in the signal. Finally, the figure also shows that the sampling of the parameter space is sufficient to cover it uniformly.
Current usage metrics show cumulative count of Article Views (full-text article views including HTML views, PDF and ePub downloads, according to the available data) and Abstracts Views on Vision4Press platform.
Data correspond to usage on the plateform after 2015. The current usage metrics is available 48-96 hours after online publication and is updated daily on week days.
Initial download of the metrics may take a while.