Fig. 6.
Download original image
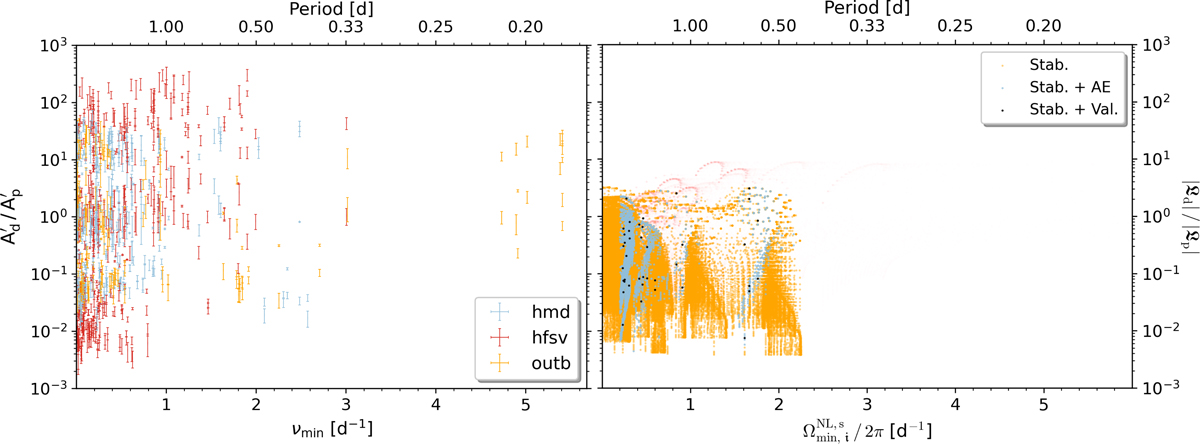
Observed daughter-parent amplitude ratios ![]() of candidate resonances of SPB stars detected in models of light curves measured by Kepler, compared to their theoretically predicted equivalent observables, the monochromatic stationary daughter-parent surface luminosity perturbation ratios |𝔏d| / |𝔏p|, which are computed with the theoretical oscillation model described in Sect. 2. These quantities are shown as a function of the minimal inertial-frame frequency νmin of the three signals in the considered candidate resonance, or, the minimal mode frequency observable
of candidate resonances of SPB stars detected in models of light curves measured by Kepler, compared to their theoretically predicted equivalent observables, the monochromatic stationary daughter-parent surface luminosity perturbation ratios |𝔏d| / |𝔏p|, which are computed with the theoretical oscillation model described in Sect. 2. These quantities are shown as a function of the minimal inertial-frame frequency νmin of the three signals in the considered candidate resonance, or, the minimal mode frequency observable ![]() among the three mode frequency observables of the considered triad, respectively. Left panel:
among the three mode frequency observables of the considered triad, respectively. Left panel: ![]() as a function of νmin. The light curve models were generated using strategy 3 of V21, which uses the signal-to-noise ratio of the detected signals to determine their significance. Colors indicate the pseudo-class defined in V21: high-fsv (‘hfsv’), high-mode-density (‘hmd’), or outbursting (‘outb’). Right panel: |𝔏d| / |𝔏p| as a function of
as a function of νmin. The light curve models were generated using strategy 3 of V21, which uses the signal-to-noise ratio of the detected signals to determine their significance. Colors indicate the pseudo-class defined in V21: high-fsv (‘hfsv’), high-mode-density (‘hmd’), or outbursting (‘outb’). Right panel: |𝔏d| / |𝔏p| as a function of ![]() . Colors indicate whether all stability criteria are fulfilled (‘Stab.’), or if additionally the AE validity criterion (‘Stab. + AE’) or all validity criteria (‘Stab. + Val.’; i.e., the isolated triads listed in Table 6) are fulfilled. We show alias signals in the frequency range of 0 to 24.4512 d−1 as fainter orange-red (‘Stab.’) symbols, because we do not account for the splitting of the alias signals (which will affect the amplitude ratios).
. Colors indicate whether all stability criteria are fulfilled (‘Stab.’), or if additionally the AE validity criterion (‘Stab. + AE’) or all validity criteria (‘Stab. + Val.’; i.e., the isolated triads listed in Table 6) are fulfilled. We show alias signals in the frequency range of 0 to 24.4512 d−1 as fainter orange-red (‘Stab.’) symbols, because we do not account for the splitting of the alias signals (which will affect the amplitude ratios).
Current usage metrics show cumulative count of Article Views (full-text article views including HTML views, PDF and ePub downloads, according to the available data) and Abstracts Views on Vision4Press platform.
Data correspond to usage on the plateform after 2015. The current usage metrics is available 48-96 hours after online publication and is updated daily on week days.
Initial download of the metrics may take a while.