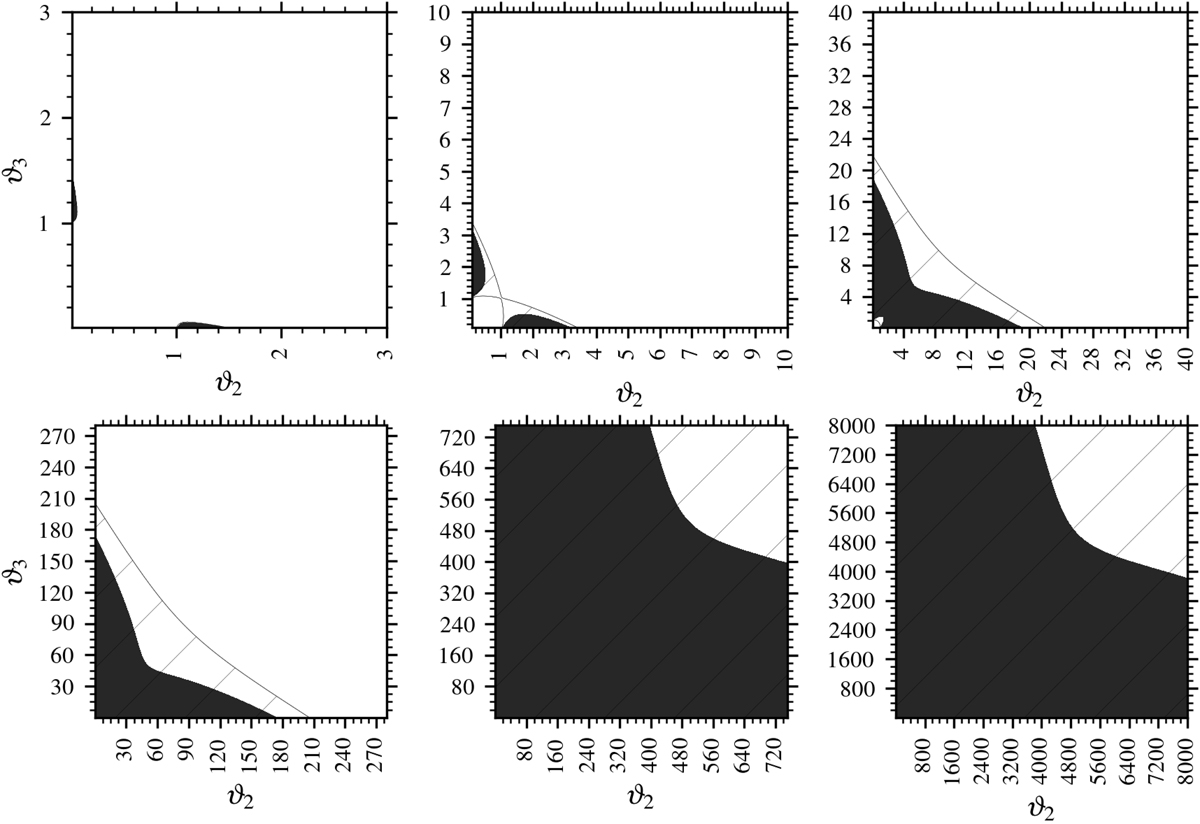
Fig. 2.
Download original image
Stability domains as a function of ϑ2 and ϑ3, indicated by the dark, shaded area, and evaluated using Eqs. (61a) and (64) for different values of |q1|. Specifically, |q1| is set equal to 0.1 (left top panel), 1 (middle top panel), 10 (right top panel), 102 (left bottom panel), 103 (middle bottom panel) and 104 (right bottom panel). The stability domain determined by the stability conditions defined in Dziembowski (1982) is larger and is also indicated in these panels by the hatched areas. Unhatched white areas of the figure panels indicate unstable domains. Note the different axis scales for the different panels, which indicates the importance of the value of |q1| in determining the stability of stationary solutions.
Current usage metrics show cumulative count of Article Views (full-text article views including HTML views, PDF and ePub downloads, according to the available data) and Abstracts Views on Vision4Press platform.
Data correspond to usage on the plateform after 2015. The current usage metrics is available 48-96 hours after online publication and is updated daily on week days.
Initial download of the metrics may take a while.