Fig. 8
Download original image
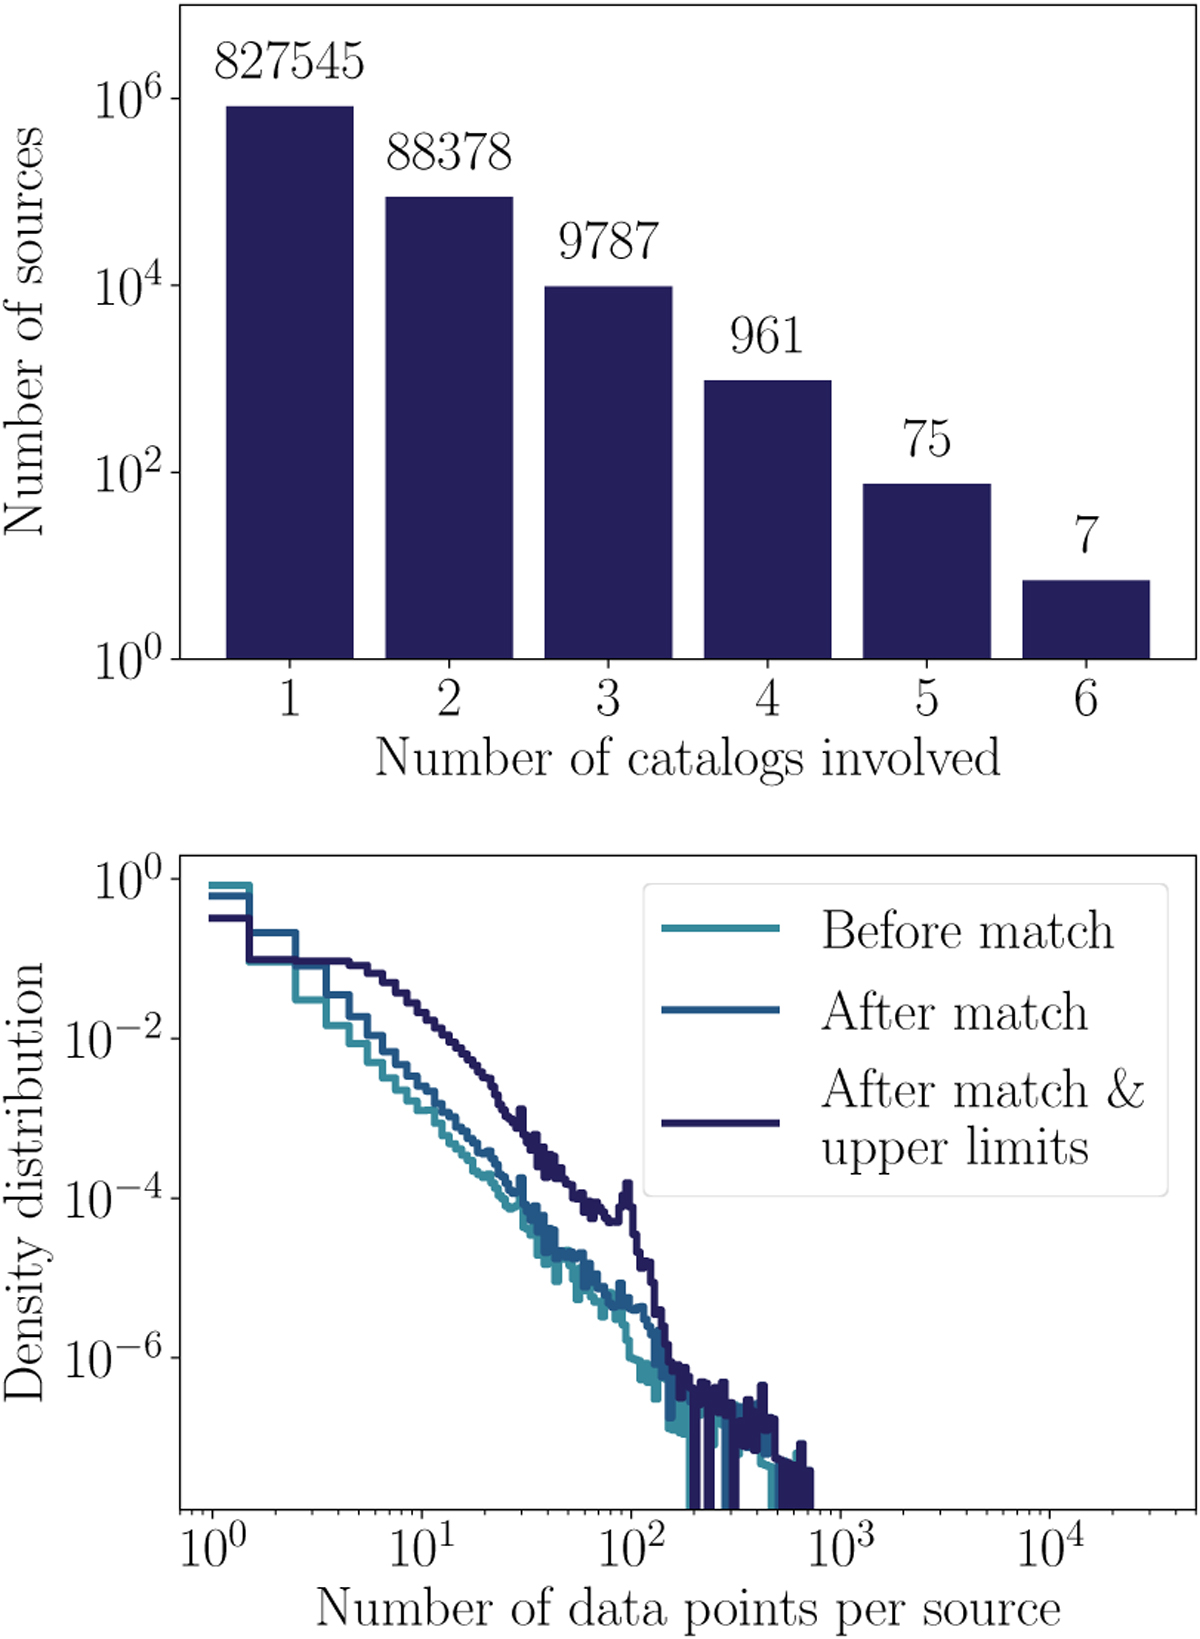
Illustration of the gain in information on the long-term evolution of X-ray sources, obtained thanks to the cross-matching & upper-limits. Top panel: distribution of the number of catalogs involved in each multi-catalog source. The majority of the sources only have data for one catalog, but for the remaining 15% at least two catalogs are involved. Despite using 7 catalogs, no source was detected in all of them (mostly due to the very constraining sky coverage of the eFEDS catalogs). Bottom panel: density distribution of the number of data points per source, before the cross-match in light blue, after the match in blue, and after taking into account upper limits in dark blue. Both the cross-match and the use of upper limits allows us to increase the number of data points per source, namely, skew this density distribution to the right.
Current usage metrics show cumulative count of Article Views (full-text article views including HTML views, PDF and ePub downloads, according to the available data) and Abstracts Views on Vision4Press platform.
Data correspond to usage on the plateform after 2015. The current usage metrics is available 48-96 hours after online publication and is updated daily on week days.
Initial download of the metrics may take a while.