Fig. 6
Download original image
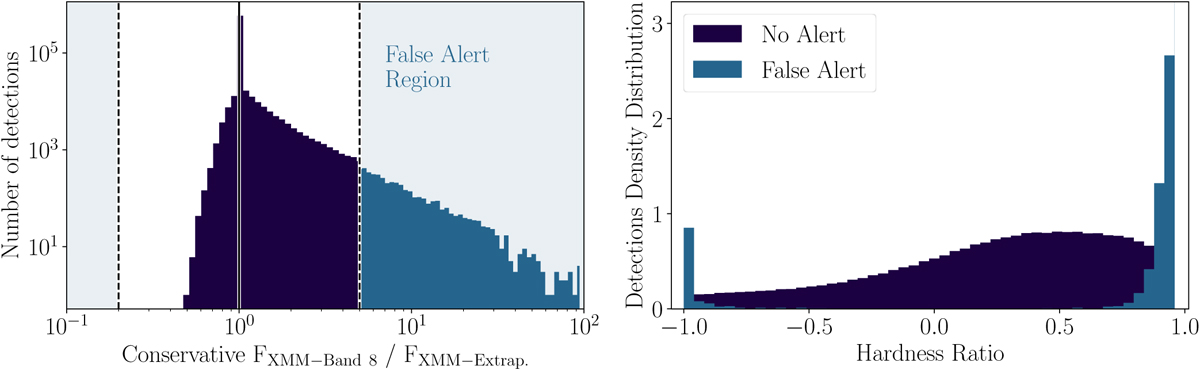
Assessment of the effect of the spectral assumption on variability estimates. Left panel: distribution of the conservative estimate of the variability between the true flux, and the one obtained after cropping to the Chandra bandwidth and extrapolation to the 0.1–12 keV band. All detections with a variability larger than a factor of 5 between both methods would lead to spurious transient alerts. Right panel: comparison between the hardness ratio density distributions of the detections that lead to spurious alerts (light blue) and the ones without alerts (dark blue). This confirms that spurious alerts can happen in the case where the spectral assumption does not fit the data well, that is, for extreme hardness ratios.
Current usage metrics show cumulative count of Article Views (full-text article views including HTML views, PDF and ePub downloads, according to the available data) and Abstracts Views on Vision4Press platform.
Data correspond to usage on the plateform after 2015. The current usage metrics is available 48-96 hours after online publication and is updated daily on week days.
Initial download of the metrics may take a while.