Fig. 5
Download original image
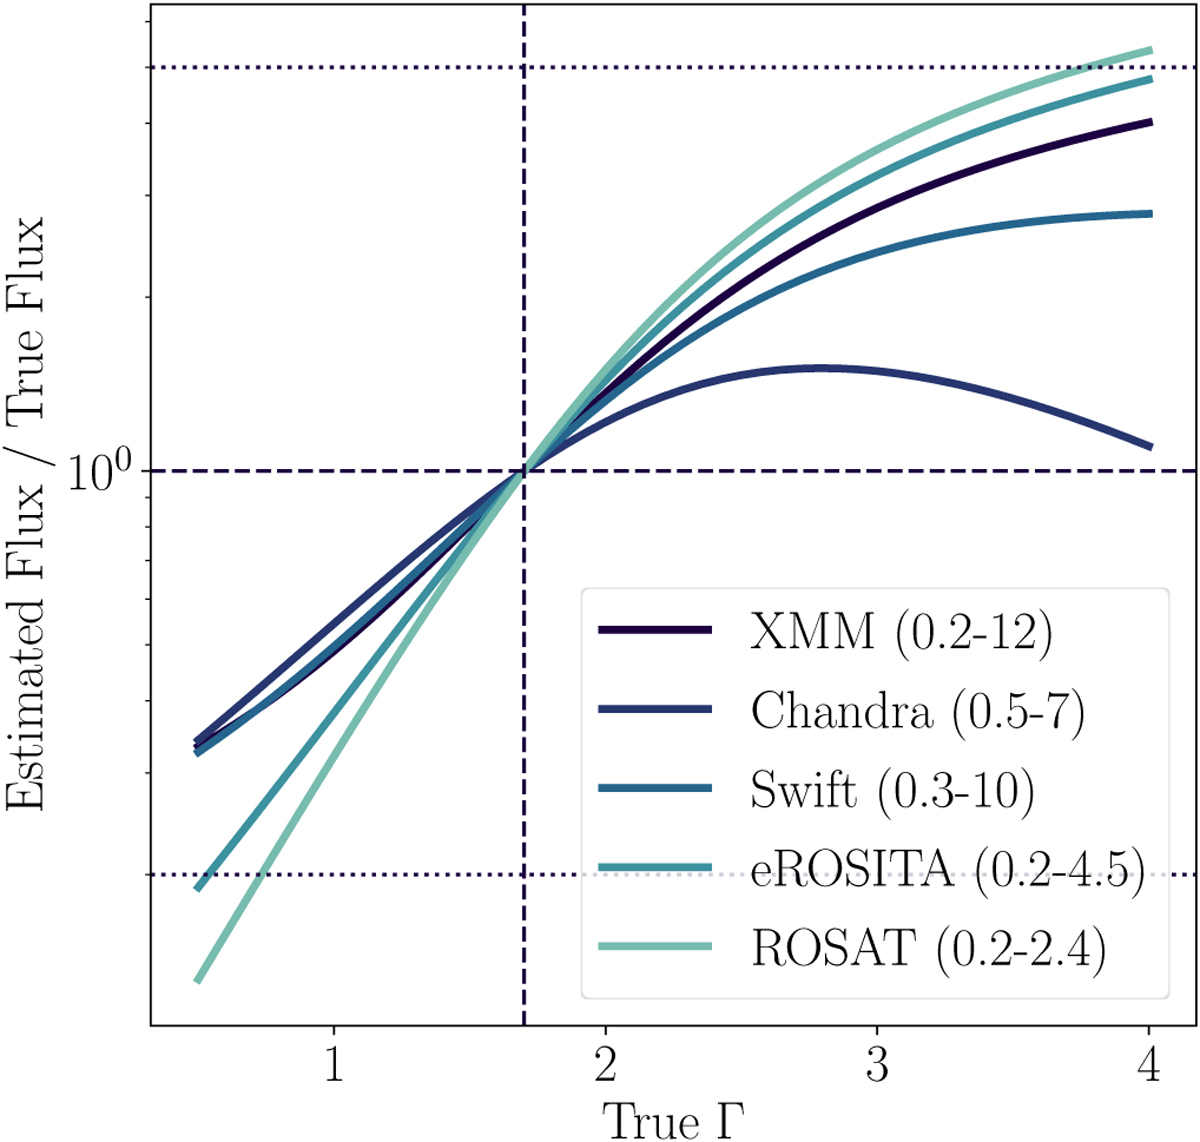
Evolution of the ratio between the flux extrapolated from each mission band assuming Γ = 1.7 and nH = 3 × 1020 cm−2, and the true flux of a source, depending on the value of its photon index Γ. The dashed lines correspond to the reference (Γ = 1.7 and ratio of 1), and the dotted lines correspond to a factor of 5. While ROSAT goes over the threshold of 5 for the softest sources, what matters most to our study is that at a given Γ the ratio between different missions is below five (to avoid spurious alerts).
Current usage metrics show cumulative count of Article Views (full-text article views including HTML views, PDF and ePub downloads, according to the available data) and Abstracts Views on Vision4Press platform.
Data correspond to usage on the plateform after 2015. The current usage metrics is available 48-96 hours after online publication and is updated daily on week days.
Initial download of the metrics may take a while.