Fig. 4
Download original image
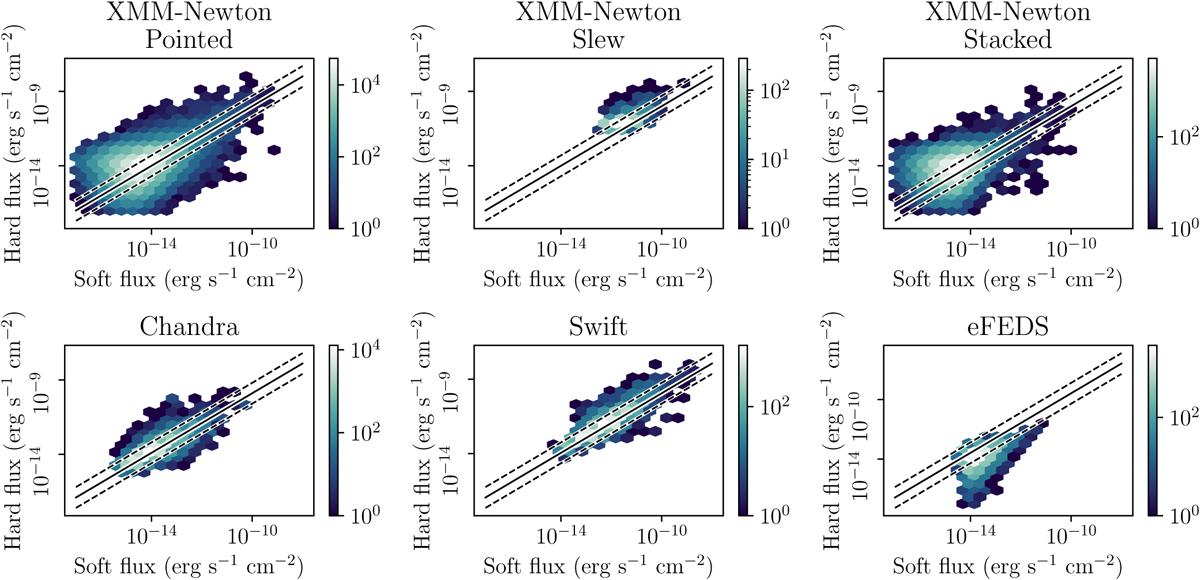
Comparison between the hard and soft fluxes for each mission with hard detections (i.e., >2 keV). The black lines show the expected behavior of the spectral assumption (absorbed power law of NH = 3 × 1020 cm−2 and Γ = 1.7), and the black dotted lines show a departure by a factor of 5 from this behavior. While the spread around the assumed shape can appear significant, it is important to remember that the error bars on these hard and soft fluxes are significant as well (typically signal to noise ratio of about 3 or less), so the statistical significance of the spread is reduced
Current usage metrics show cumulative count of Article Views (full-text article views including HTML views, PDF and ePub downloads, according to the available data) and Abstracts Views on Vision4Press platform.
Data correspond to usage on the plateform after 2015. The current usage metrics is available 48-96 hours after online publication and is updated daily on week days.
Initial download of the metrics may take a while.