Fig. 2
Download original image
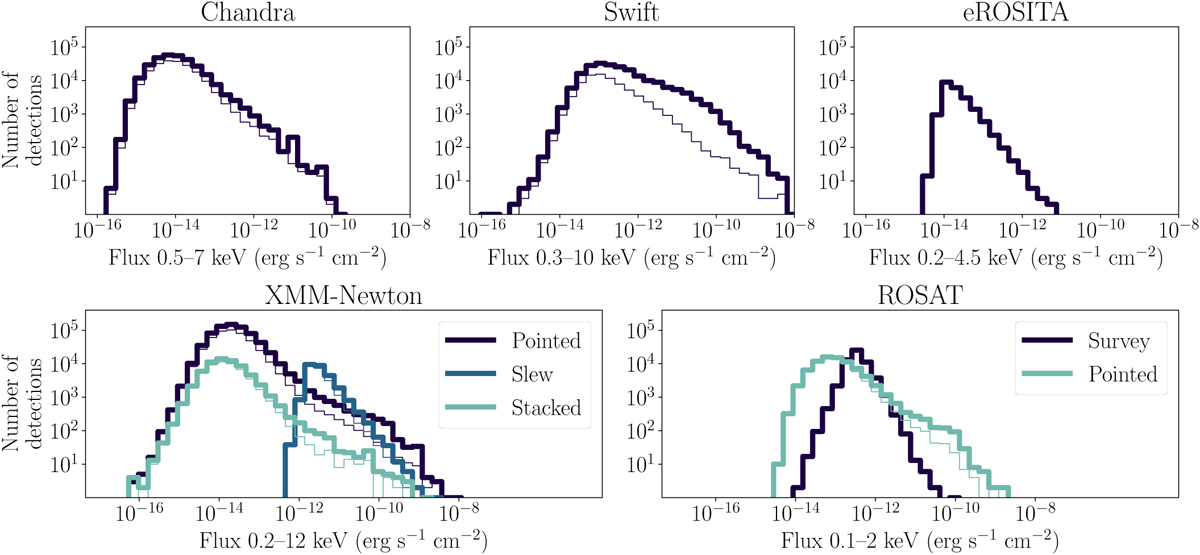
Flux distributions of each X-ray observatory used in this study, in their native energy band, with the different catalogs shown in different colors. For each catalog, we show the flux distribution of all detections (thick line), as well as the flux distribution averaged for each source (thin line). The difference between the detection-wise and source-wise flux distributions depends on the observational strategy of each X-ray instrument.
Current usage metrics show cumulative count of Article Views (full-text article views including HTML views, PDF and ePub downloads, according to the available data) and Abstracts Views on Vision4Press platform.
Data correspond to usage on the plateform after 2015. The current usage metrics is available 48-96 hours after online publication and is updated daily on week days.
Initial download of the metrics may take a while.