Open Access
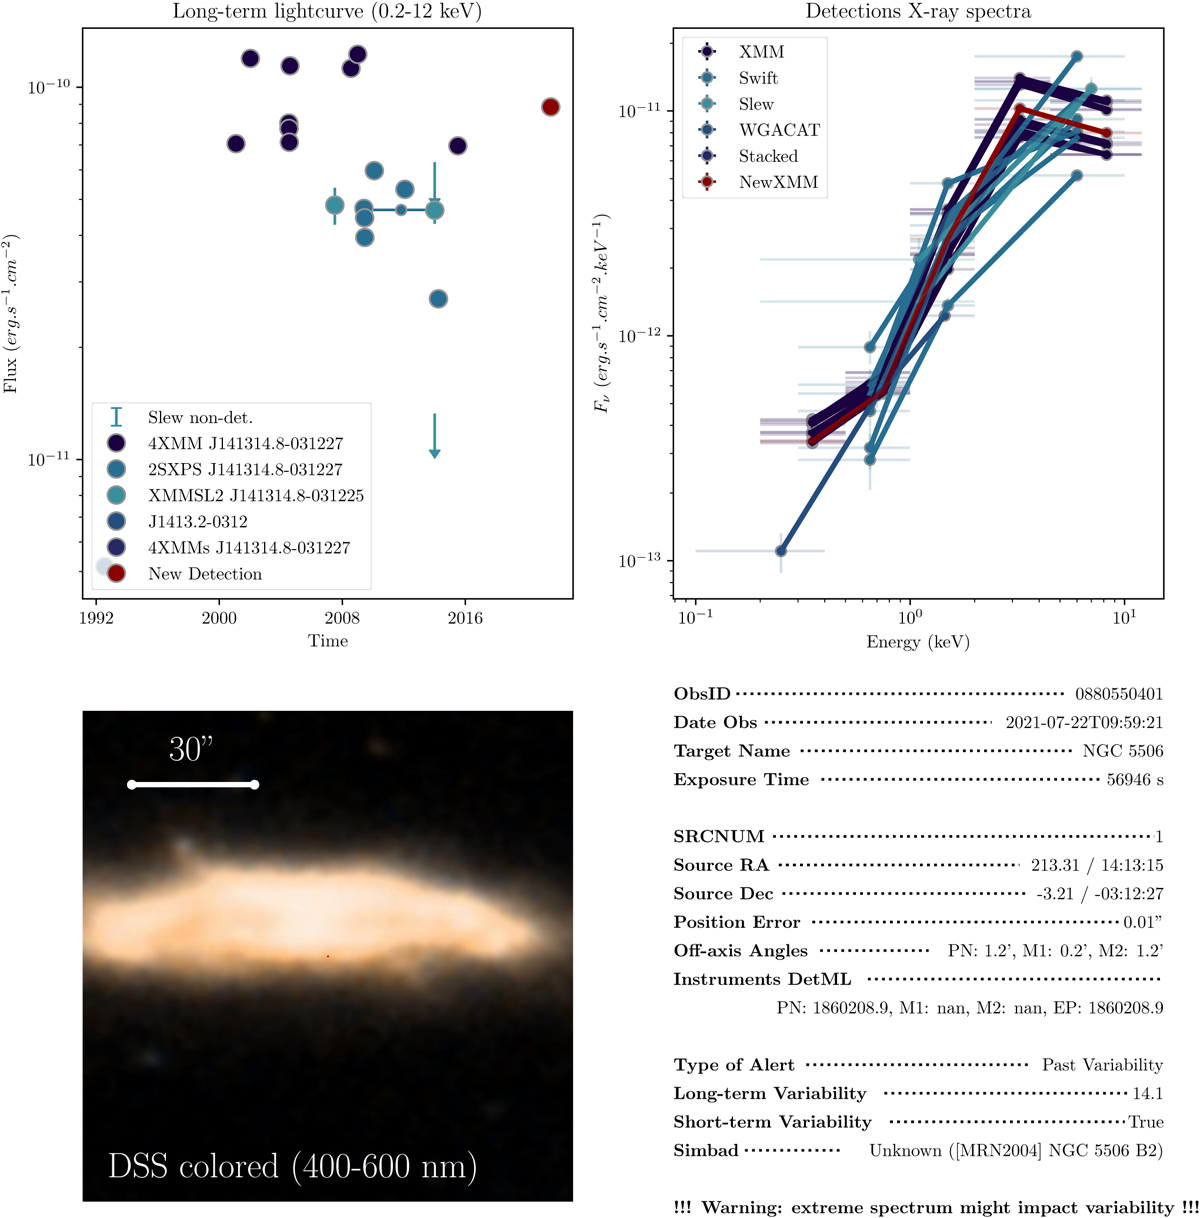
Fig. C.2
Download original image
Example of spurious variability due to the hardness of the source (here, due to the amount of absorption in the host galaxy). The tiny red dot in the middle of the DSS image (bottom left) is the 1σ positional error circle of the X-ray source.
Current usage metrics show cumulative count of Article Views (full-text article views including HTML views, PDF and ePub downloads, according to the available data) and Abstracts Views on Vision4Press platform.
Data correspond to usage on the plateform after 2015. The current usage metrics is available 48-96 hours after online publication and is updated daily on week days.
Initial download of the metrics may take a while.