Fig. 11
Download original image
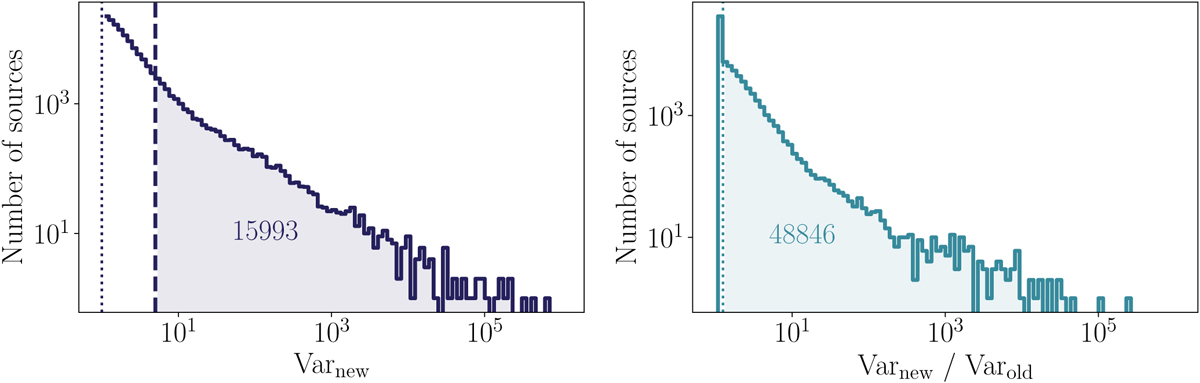
Illustration of the long-term X-ray variability revealed by our method. Left panel: distribution of the variability for the multi-instrument sources, including the XMM-Newton upper limits. We only show sources consistent with being variable (i.e., Varnew>1, on the right of the vertical dotted line). The vertical dashed line shows the arbitrary limit for what we consider as significant variability (i.e., pessimistic amplitude above 5). Out of the ~135 000 sources with Varnew>1, only ~16 000 have Varnew>5. Right panel: distribution of improvement of variability between all the initial single-catalog sources for which a variability estimate was available, and the final multi-instrument source. The vertical dotted line signifies the limit between single-catalog sources for which the new variability is larger than the prior estimate (~49 000 sources out of ~95 000), and the ones where the new method does not improve the variability estimate (~46 000).
Current usage metrics show cumulative count of Article Views (full-text article views including HTML views, PDF and ePub downloads, according to the available data) and Abstracts Views on Vision4Press platform.
Data correspond to usage on the plateform after 2015. The current usage metrics is available 48-96 hours after online publication and is updated daily on week days.
Initial download of the metrics may take a while.