Fig. 6
Download original image
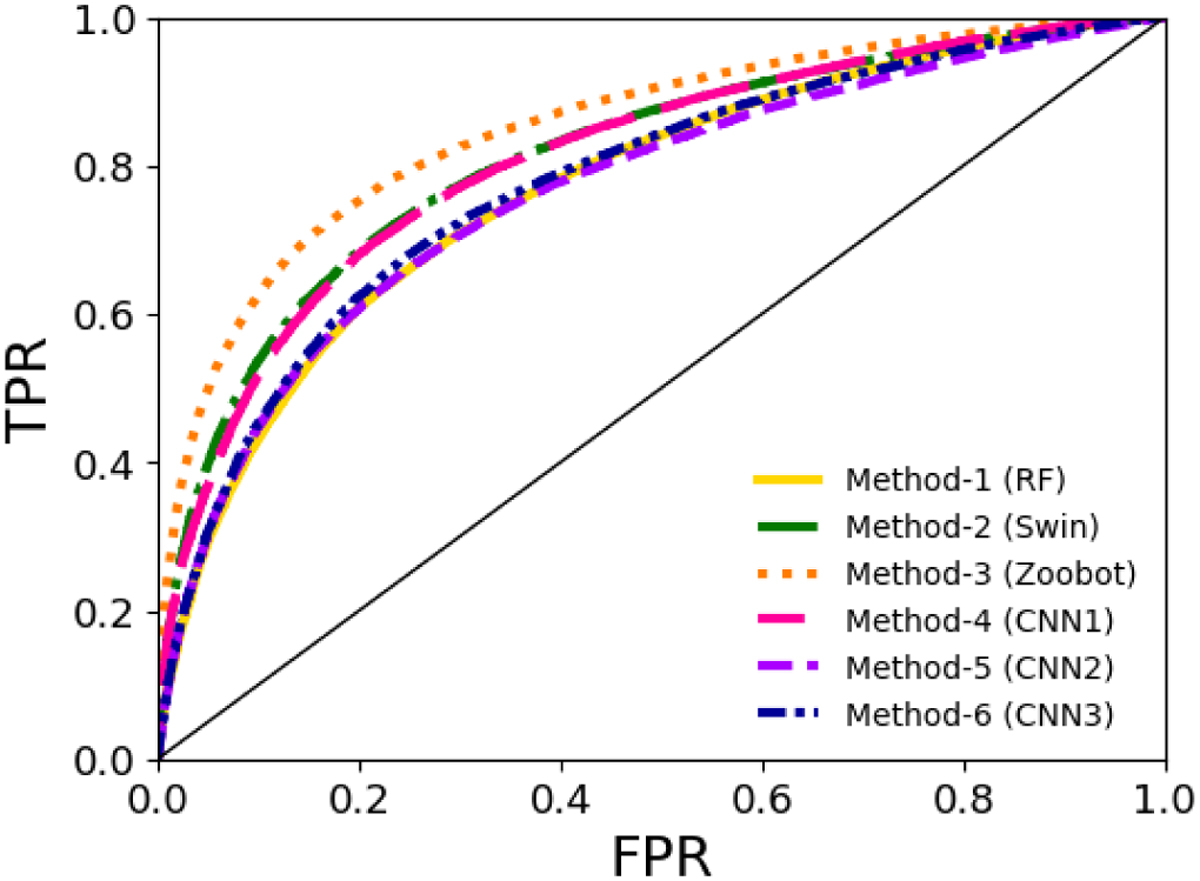
ROC for the TNG test set. The ROC curves show the overall performance of each method independently of the chosen classification threshold. The farther the curve is from the 1:1 line (which represents a random classifier) or the greater the area under the curve, the better the model. Method-3 (Zoobot) shows the best performance in terms of ROC.
Current usage metrics show cumulative count of Article Views (full-text article views including HTML views, PDF and ePub downloads, according to the available data) and Abstracts Views on Vision4Press platform.
Data correspond to usage on the plateform after 2015. The current usage metrics is available 48-96 hours after online publication and is updated daily on week days.
Initial download of the metrics may take a while.