Open Access
Fig. A.2
Download original image
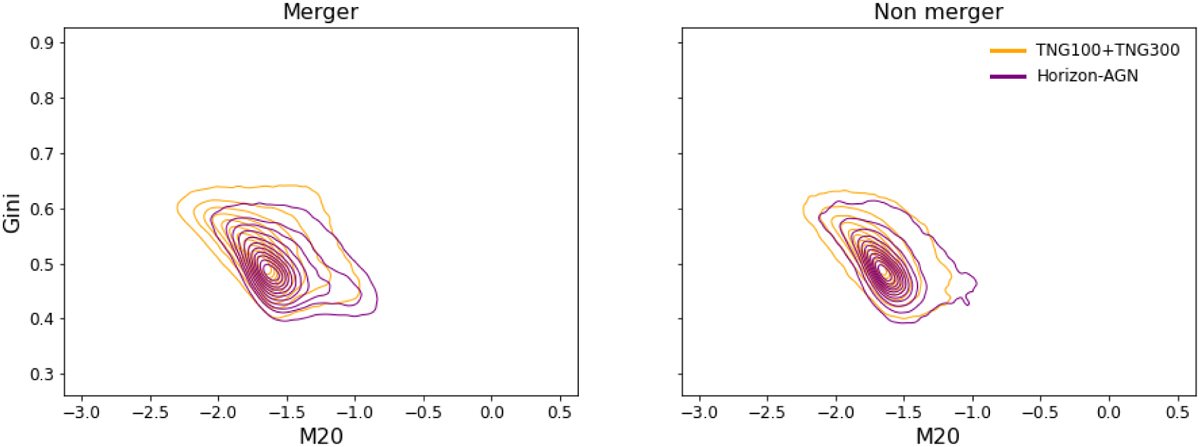
Gini-M20 relationship for mergers (left) and non-mergers (right), for the two simulations (TNG100 and TNG300 combined in yellow, and Horizon-AGN in purple).
Current usage metrics show cumulative count of Article Views (full-text article views including HTML views, PDF and ePub downloads, according to the available data) and Abstracts Views on Vision4Press platform.
Data correspond to usage on the plateform after 2015. The current usage metrics is available 48-96 hours after online publication and is updated daily on week days.
Initial download of the metrics may take a while.