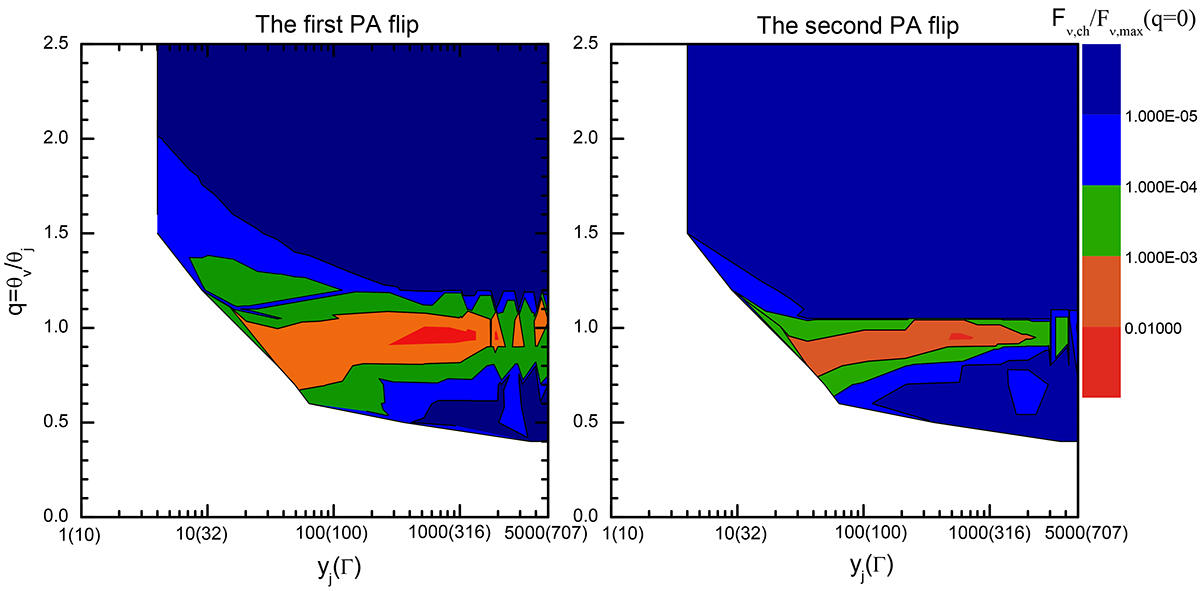
Fig. 8.
Download original image
Contour plots of normalized flux at the time of the first (left panel) and second (right panel) PA flip in the two-dimensional parameter space of q versus yj. We note that there is no PA flip when q ≃ 1, which is not marked in the figure. In this group of calculations, we fixed θj = 0.1 radians and changed Γ. The numbers in parentheses on the horizontal axis represent the values of the corresponding Lorentz factors.
Current usage metrics show cumulative count of Article Views (full-text article views including HTML views, PDF and ePub downloads, according to the available data) and Abstracts Views on Vision4Press platform.
Data correspond to usage on the plateform after 2015. The current usage metrics is available 48-96 hours after online publication and is updated daily on week days.
Initial download of the metrics may take a while.