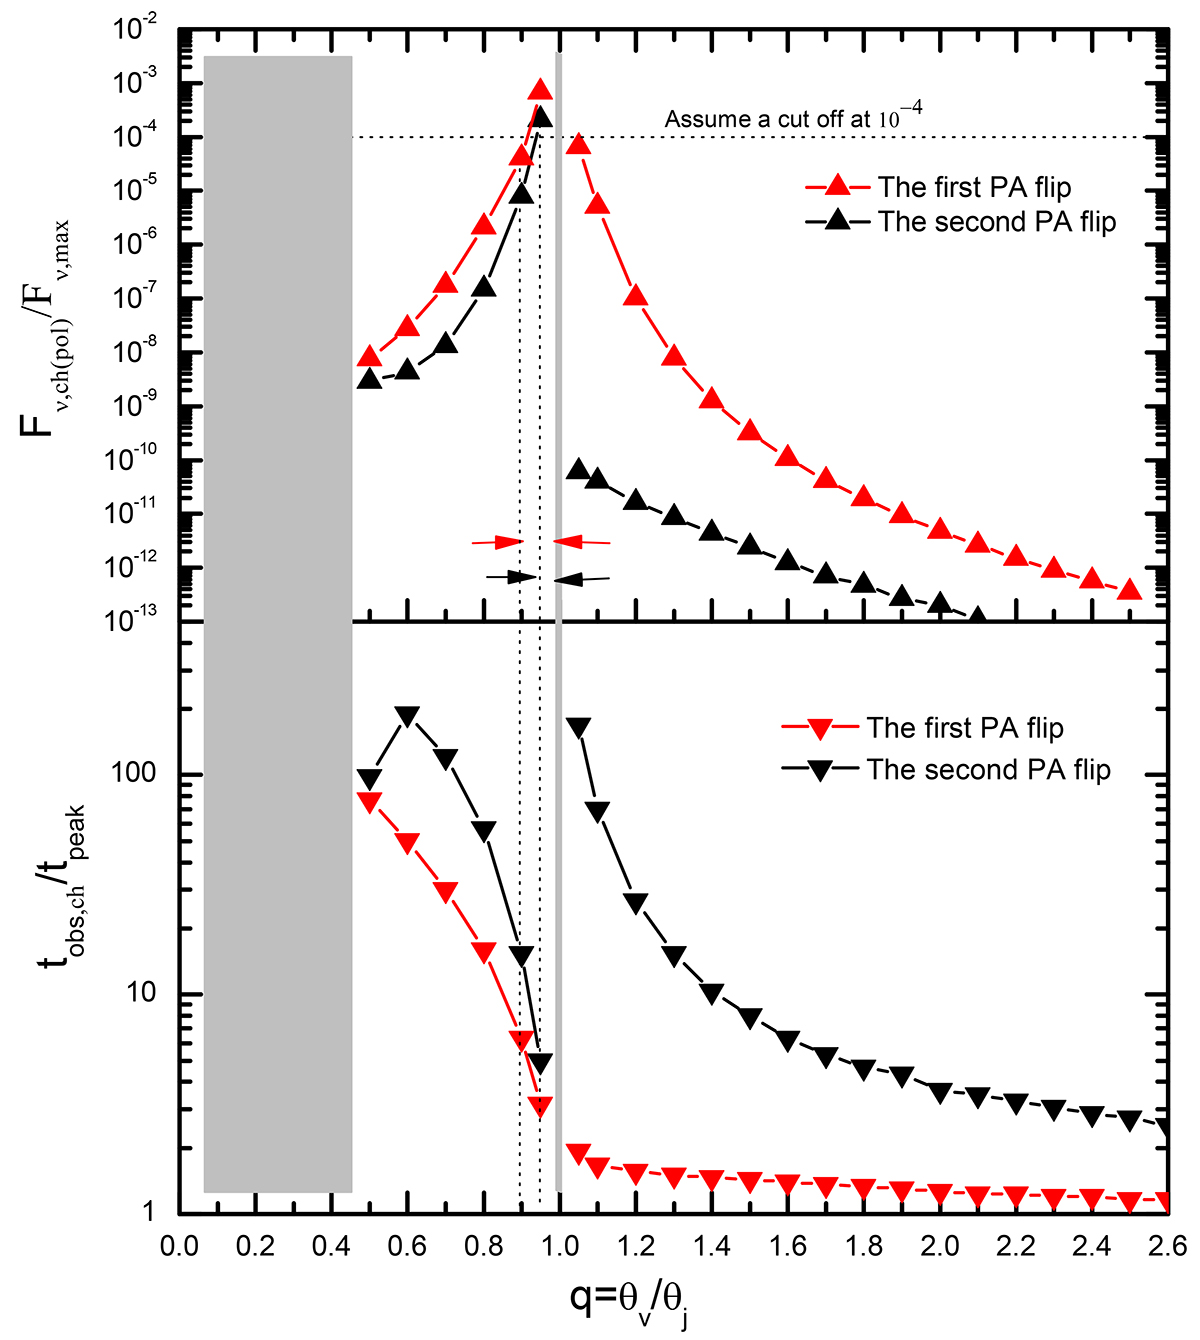
Fig. 13.
Download original image
Estimation of the observed rate of GRBs with 90-degree PA flips and the time nodes of these flips. Upper panel shows the normalized maximal post-flip polarized flux with different q by taking typical parameters of Γ = 300 and θj = 0.1. The bottom panel shows the normalized time at PA flip (tobs, ch/tpeak) with different q. The gray regions represent that there are no PA flips in these areas.
Current usage metrics show cumulative count of Article Views (full-text article views including HTML views, PDF and ePub downloads, according to the available data) and Abstracts Views on Vision4Press platform.
Data correspond to usage on the plateform after 2015. The current usage metrics is available 48-96 hours after online publication and is updated daily on week days.
Initial download of the metrics may take a while.