Fig. 9
Download original image
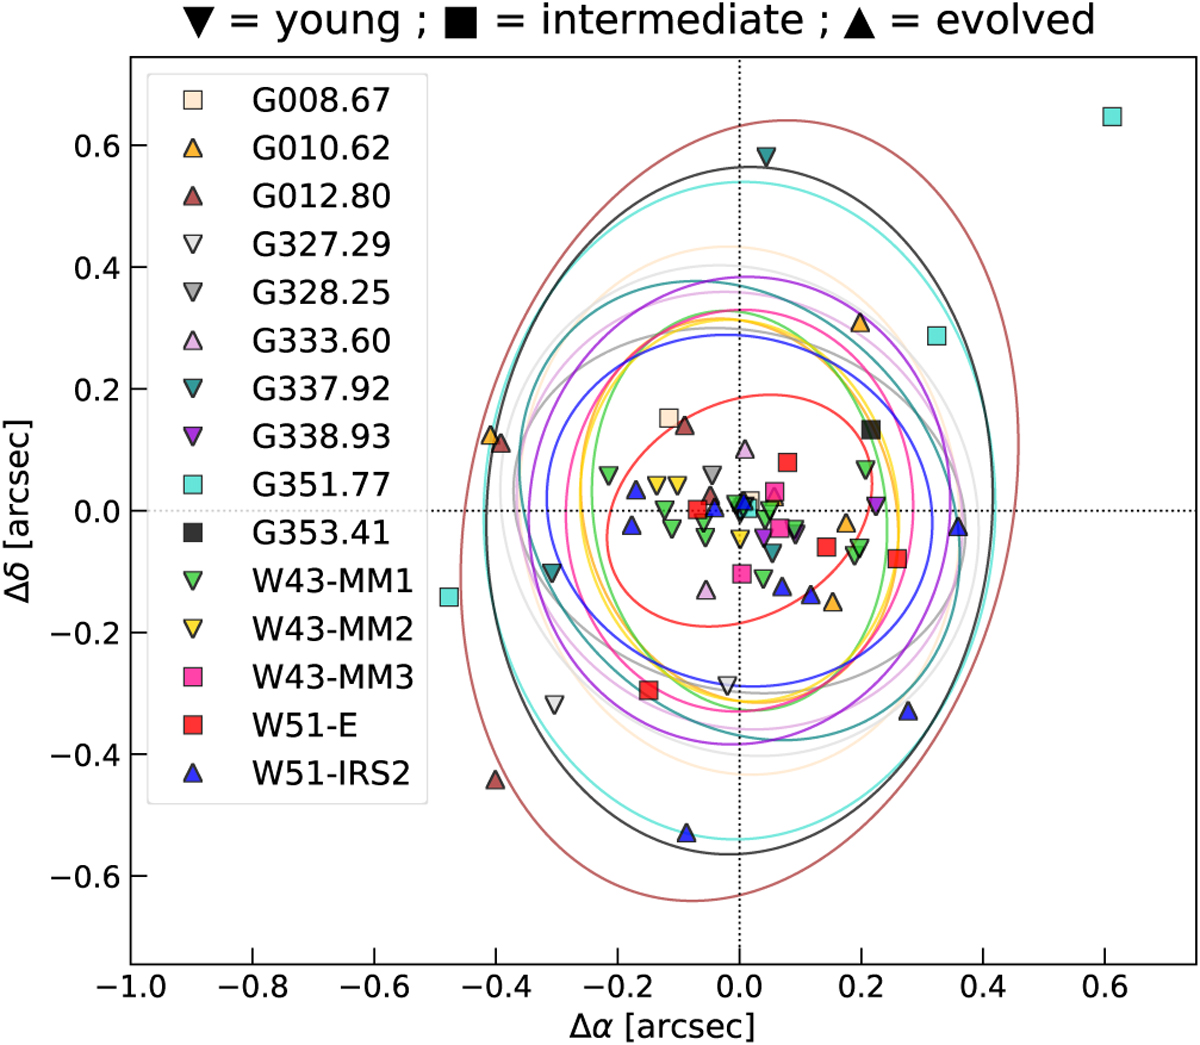
2D distribution of the angular offsets between the peak position of each CH3OCHO source extracted with GExt2D and its associated continuum core extracted with getsf. The different symbols represent the different evolutionary stages of the protoclusters – young, intermediate, or evolved – as shown on top of the plot. The dashed vertical and horizontal lines indicate the x = 0 and y = 0 axes, respectively. The ellipses represent the synthesized beam sizes (FWHM) of the 15 ALMA-IMF B6-spw0 line cubes. The diameter of the corresponding ellipse (i.e., θave) is used as a criterion to associate CH3OCHO sources with continuum cores toward each protocluster. The methyl formate sources that are not associated with any compact continuum core are not shown in this figure.
Current usage metrics show cumulative count of Article Views (full-text article views including HTML views, PDF and ePub downloads, according to the available data) and Abstracts Views on Vision4Press platform.
Data correspond to usage on the plateform after 2015. The current usage metrics is available 48-96 hours after online publication and is updated daily on week days.
Initial download of the metrics may take a while.