Fig. 3
Download original image
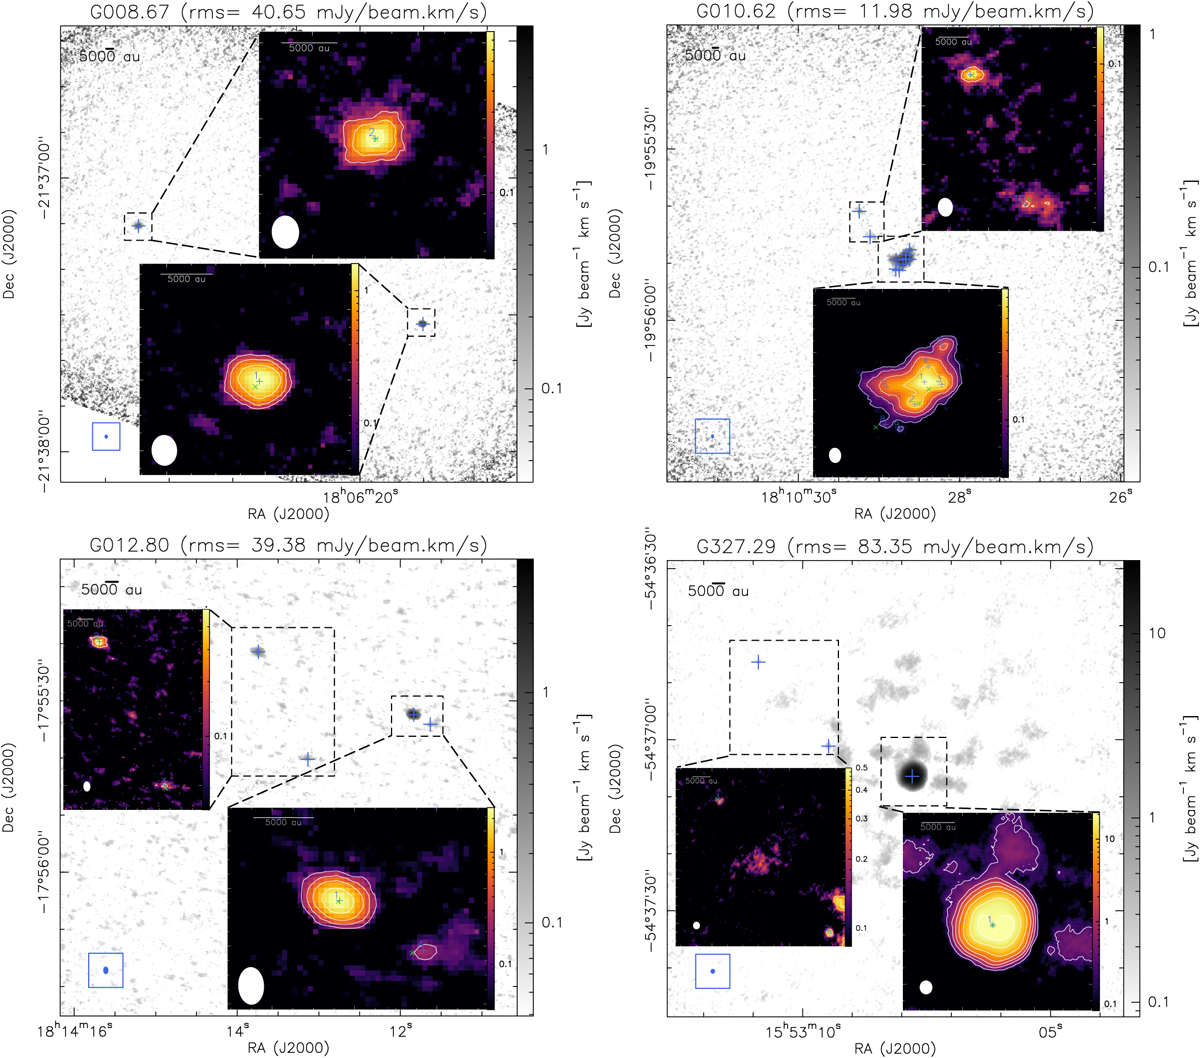
Moment 0 maps of methyl formate obtained toward the ALMA-IMF protoclusters as described in Sect. 3.1. Contours start at 5σ (the 1σ rms noise level is indicated on top of each panel) and double in value thereafter. In each panel the blue crosses show the peak positions of the methyl formate sources extracted with GExt2D, while the green crosses show their associated continuum cores from the getsf-unsmoothed catalog (Paper XII). The blue or white ellipses in each panel represent the synthesized beam of the line cubes.
Current usage metrics show cumulative count of Article Views (full-text article views including HTML views, PDF and ePub downloads, according to the available data) and Abstracts Views on Vision4Press platform.
Data correspond to usage on the plateform after 2015. The current usage metrics is available 48-96 hours after online publication and is updated daily on week days.
Initial download of the metrics may take a while.