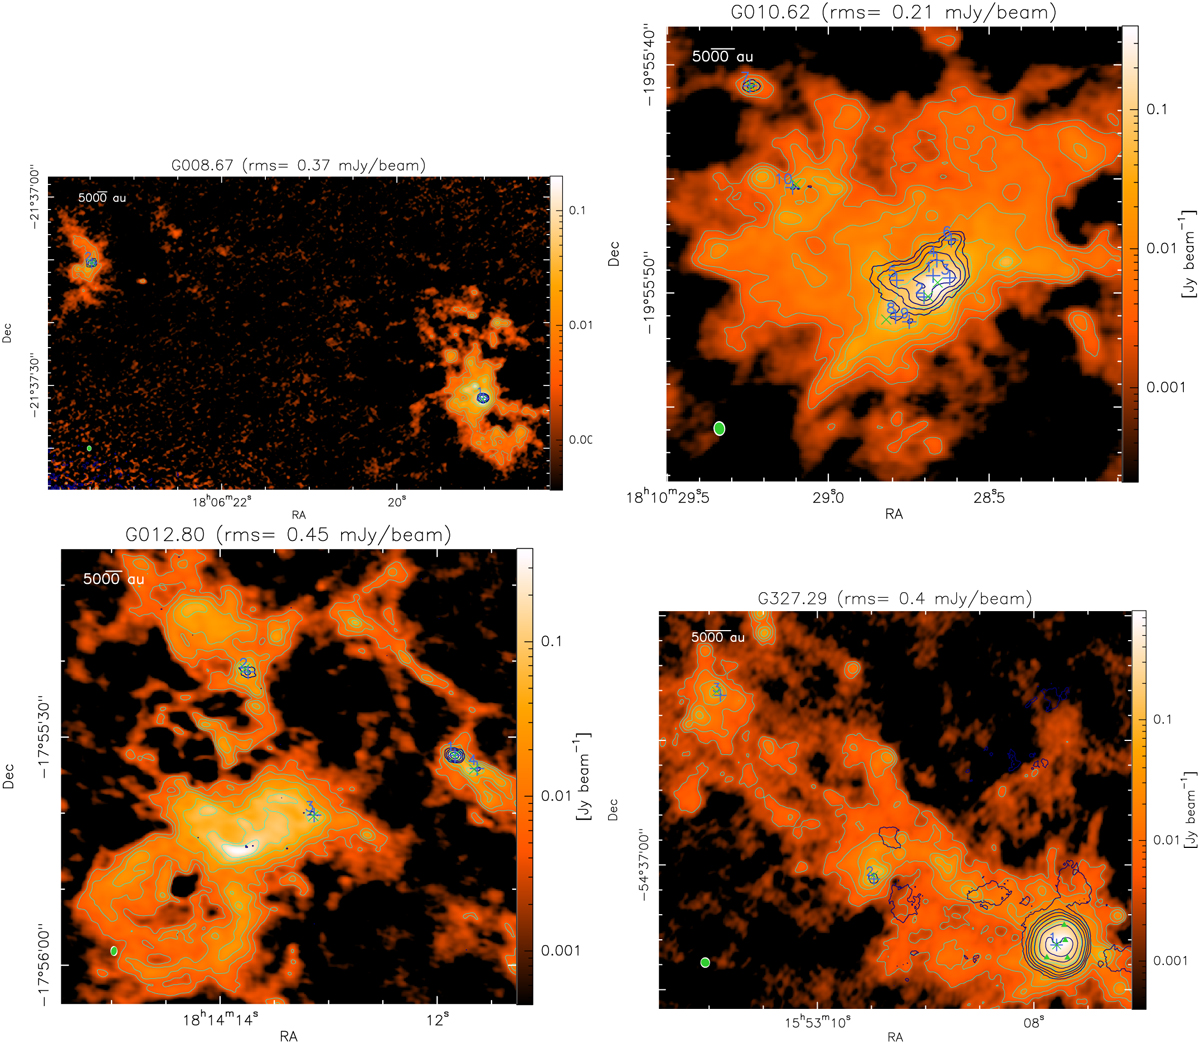
Fig. B.1
Download original image
Continuum emission maps obtained at 1.3 mm toward the ALMA-IMF protoclusters (background image). The contours, shown in light blue, start at 5 σ and double in value thereafter. The 1 σ rms noise level measured in each continuum map is indicated on top of each panel. The dark blue contours show the methyl formate integrated emission as in Fig. 3. The blue crosses show the peak positions of the methyl formate sources extracted with GExt2D, while the green crosses show their associated continuum cores from the getsf-unsmoothed catalog (Paper XII). The green triangles show the continuum cores that coincide with extended methyl formate emission but are not associated with hot core candidates and as such are not shown in the lower panel of Fig. 13. The green and white ellipses represent the synthesized beam sizes of the continuum maps and the line cubes, respectively. The figure continues on the next page.
Current usage metrics show cumulative count of Article Views (full-text article views including HTML views, PDF and ePub downloads, according to the available data) and Abstracts Views on Vision4Press platform.
Data correspond to usage on the plateform after 2015. The current usage metrics is available 48-96 hours after online publication and is updated daily on week days.
Initial download of the metrics may take a while.