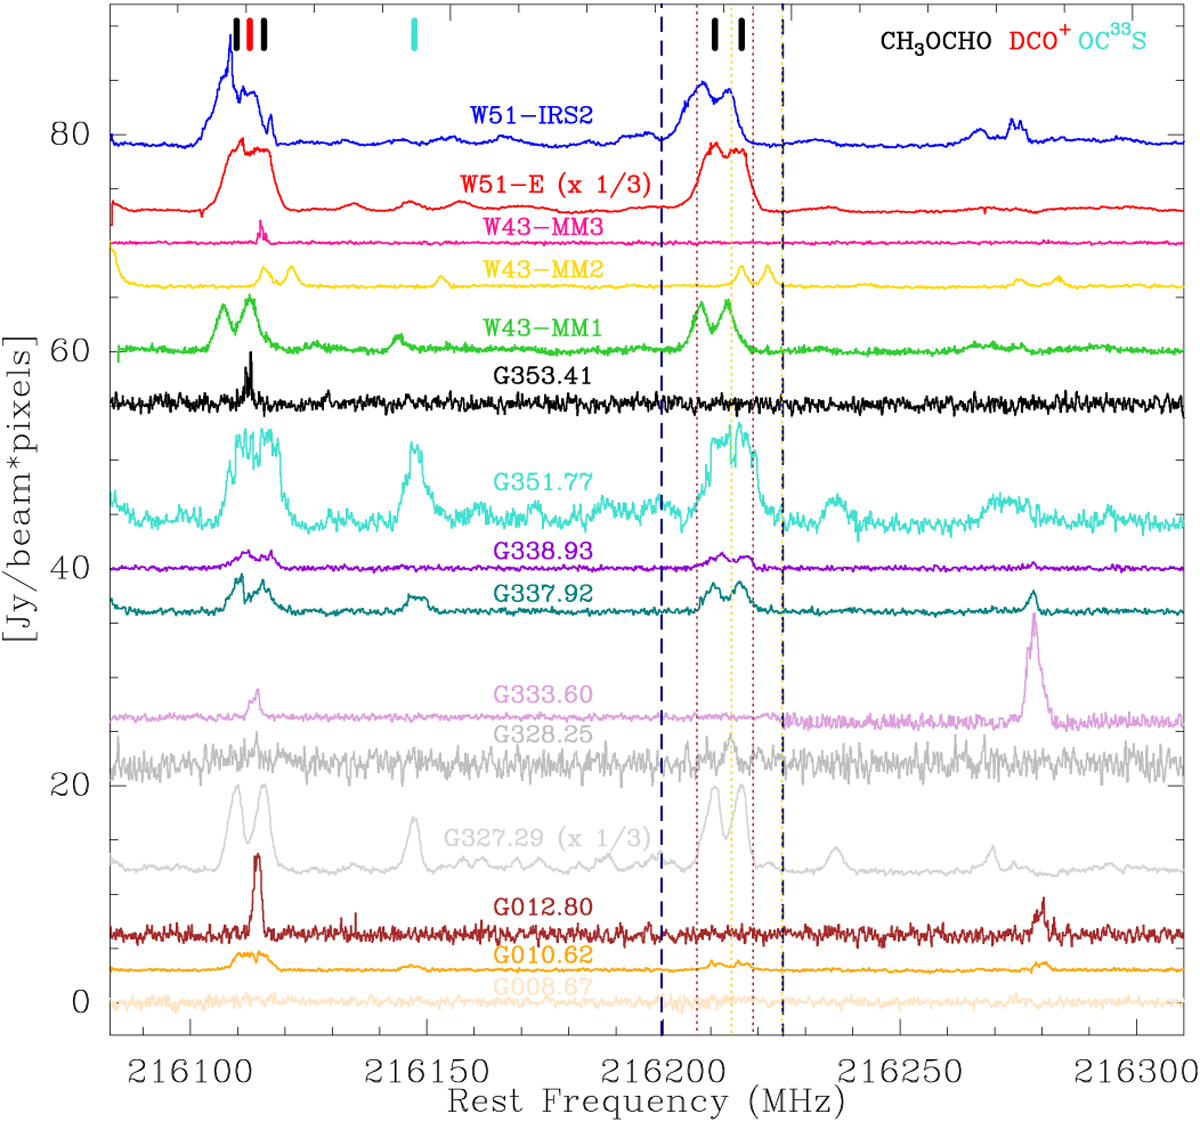
Fig. 2
Download original image
Continuum-subtracted spectra integrated over the full field of view of the 15 ALMA-IMF B6-spw0 line cubes. The value in parentheses (if any) indicates the scaling factor applied to the spectrum. The vertical dashed dark blue lines show the channel range used to compute the moment 0 maps of methyl formate for all protoclusters except G012.80 and W43-MM2, for which tighter velocity ranges, shown with dotted brown and yellow lines, respectively, were used. The vertical colored bars on top of the plot show the rest frequencies of the corresponding species, indicated in the top-right corner.
Current usage metrics show cumulative count of Article Views (full-text article views including HTML views, PDF and ePub downloads, according to the available data) and Abstracts Views on Vision4Press platform.
Data correspond to usage on the plateform after 2015. The current usage metrics is available 48-96 hours after online publication and is updated daily on week days.
Initial download of the metrics may take a while.