Fig. A.1
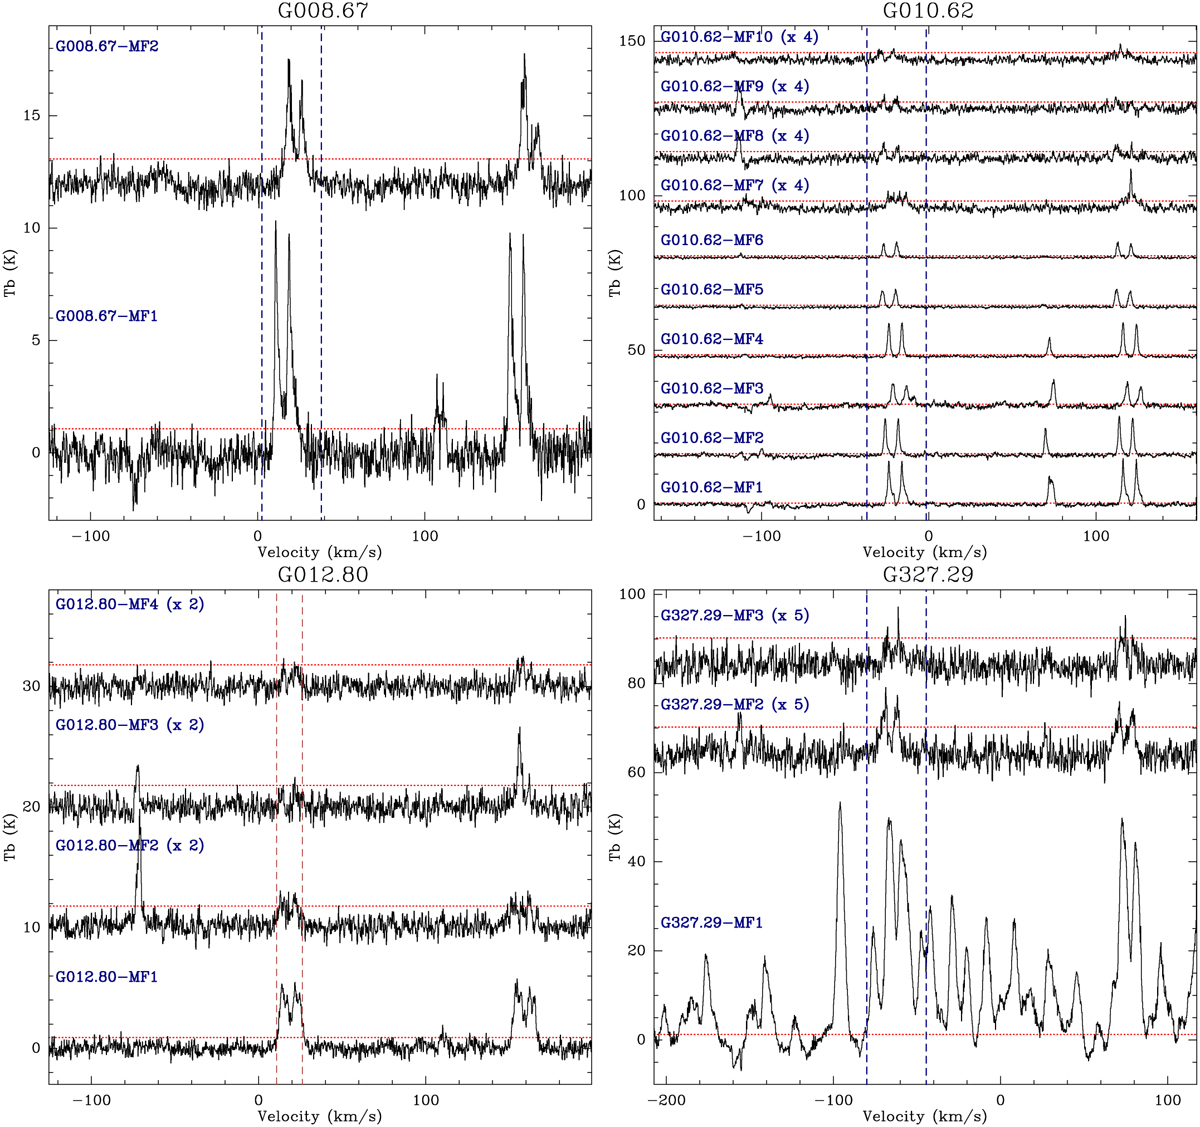
Download original image
Single-pixel continuum-subtracted spectra extracted toward the peak position of the compact methyl formate sources in the ALMA-IMF protoclusters. The spectra are shifted along the y axis and the value in parentheses (if any), indicates the scaling factor applied to the spectrum. The vertical dashed lines show the velocity range used to compute the methyl formate moment 0 maps as in Fig. 2. The red horizontal dotted lines show the 3σ threshold, using the rms noise level measured in the line cubes (see Table 2). The figure continues on the next page.
Current usage metrics show cumulative count of Article Views (full-text article views including HTML views, PDF and ePub downloads, according to the available data) and Abstracts Views on Vision4Press platform.
Data correspond to usage on the plateform after 2015. The current usage metrics is available 48-96 hours after online publication and is updated daily on week days.
Initial download of the metrics may take a while.