Fig. 17
Download original image
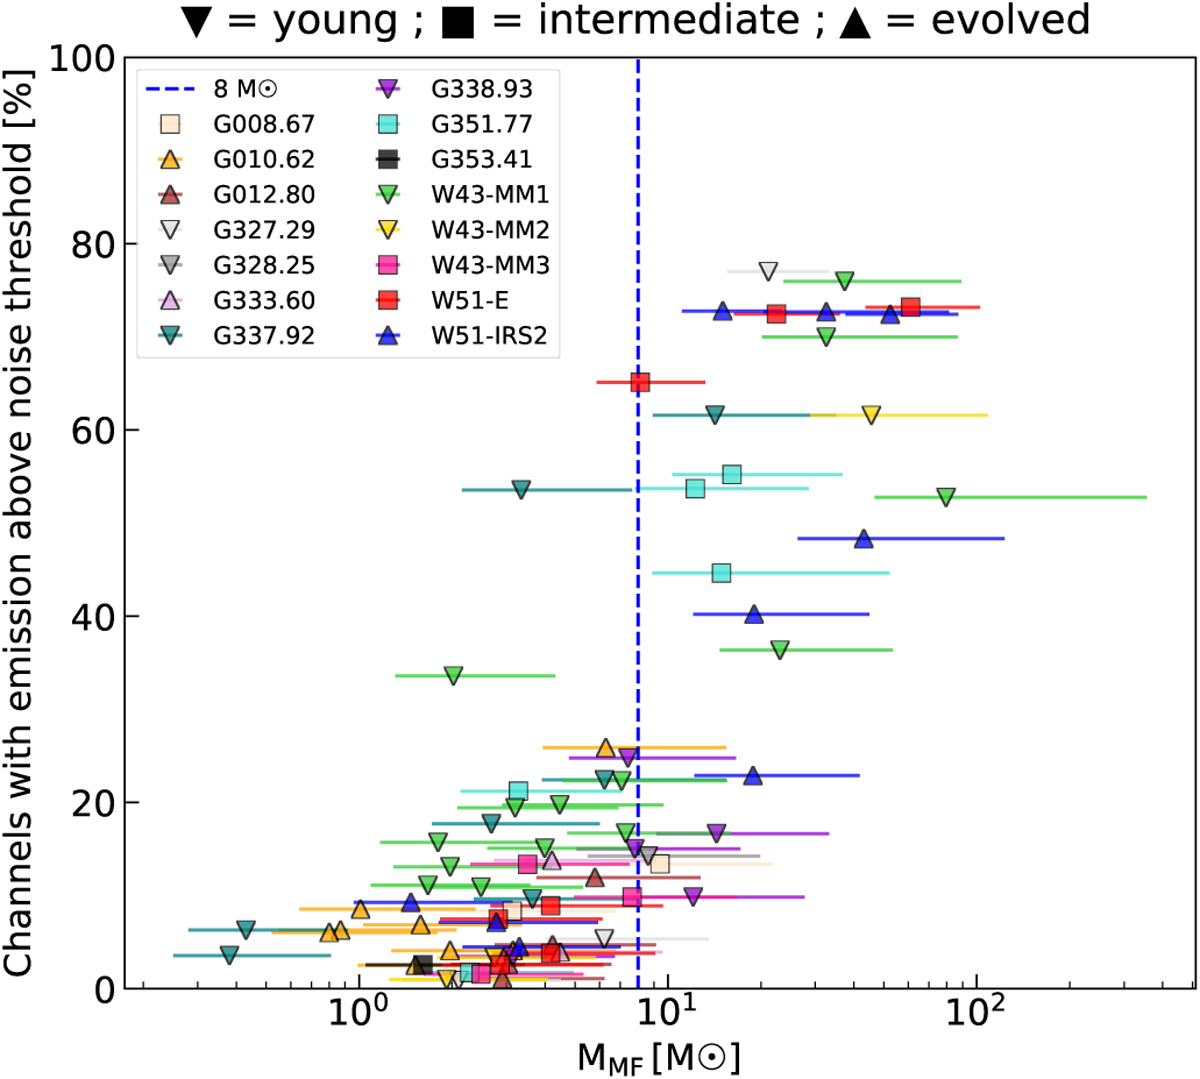
Number of channels that contain emission above the 3σ noise level in the observed spectrum (Table 4) as a function of the masses of the methyl formate sources. The different symbols represent the different evolutionary stages of the protoclusters: young, intermediate and evolved, as indicated on top of the figure, while the stars shows the methyl formate sources that are not associated with any compact dust continuum core. The horizontal dashed blue line shows the mass threshold of 8 M⊙.
Current usage metrics show cumulative count of Article Views (full-text article views including HTML views, PDF and ePub downloads, according to the available data) and Abstracts Views on Vision4Press platform.
Data correspond to usage on the plateform after 2015. The current usage metrics is available 48-96 hours after online publication and is updated daily on week days.
Initial download of the metrics may take a while.