Fig. 16
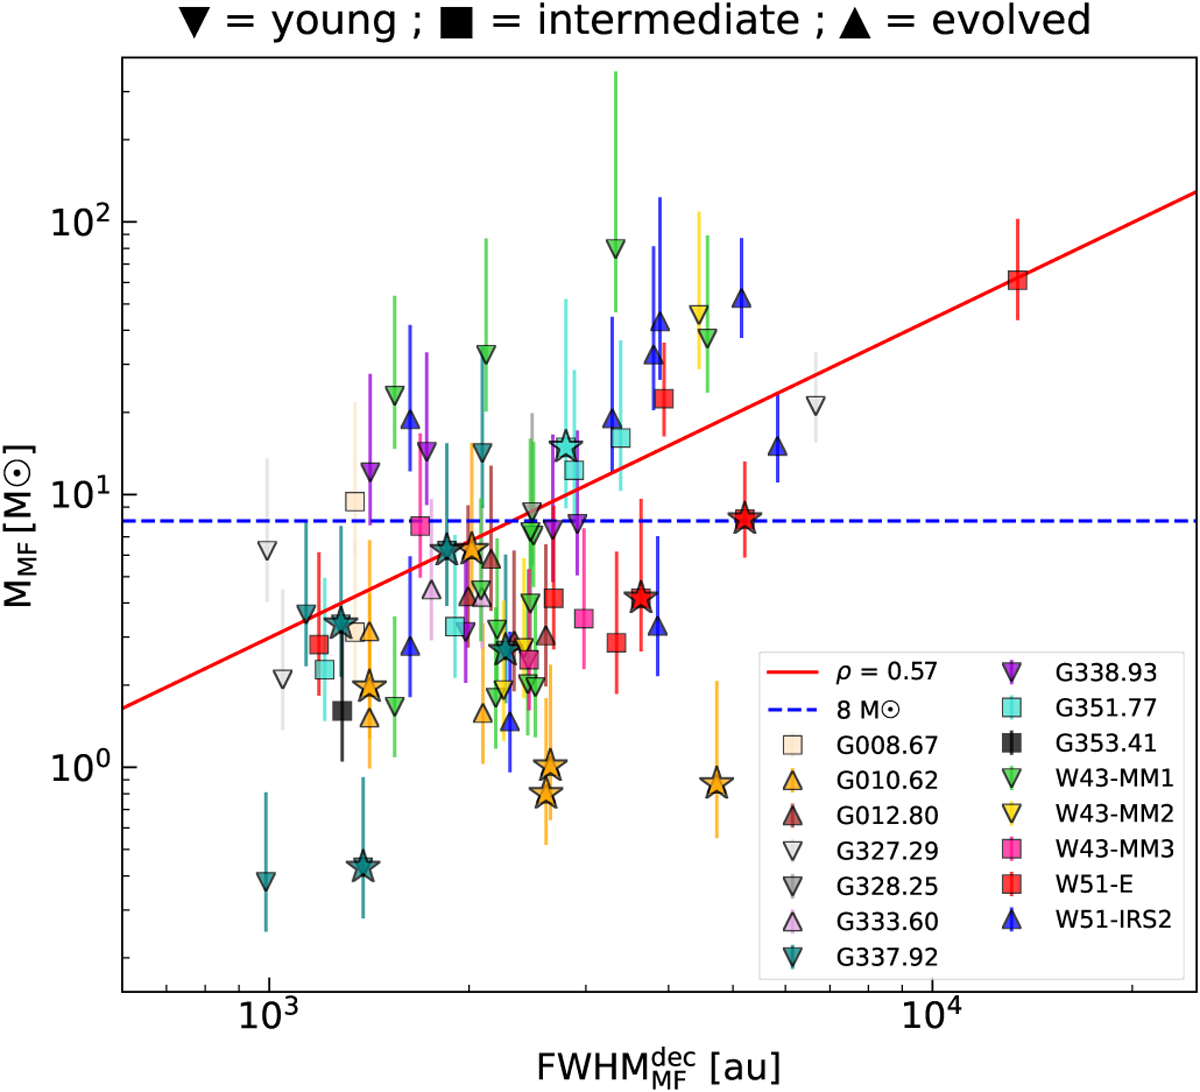
Download original image
Mass-to-size plot for the 76 methyl formate sources extracted from the moment 0 maps (Figs. 3–6). The different symbols represent the different evolutionary stages of the protoclusters: young, intermediate and evolved, as indicated on top of the figure, while the stars shows the methyl formate sources that are not associated with any compact dust continuum core. The error bars show the range of masses obtained considering the uncertainties on Td (300 ± 100K for the most extreme objects and 100 ± 50K for the rest; see Sect. 5.4). The weighted fit to the data points (red line) shows that the most massive cores tend to harbor a more extended emission of methyl formate.
Current usage metrics show cumulative count of Article Views (full-text article views including HTML views, PDF and ePub downloads, according to the available data) and Abstracts Views on Vision4Press platform.
Data correspond to usage on the plateform after 2015. The current usage metrics is available 48-96 hours after online publication and is updated daily on week days.
Initial download of the metrics may take a while.