Fig. 15
Download original image
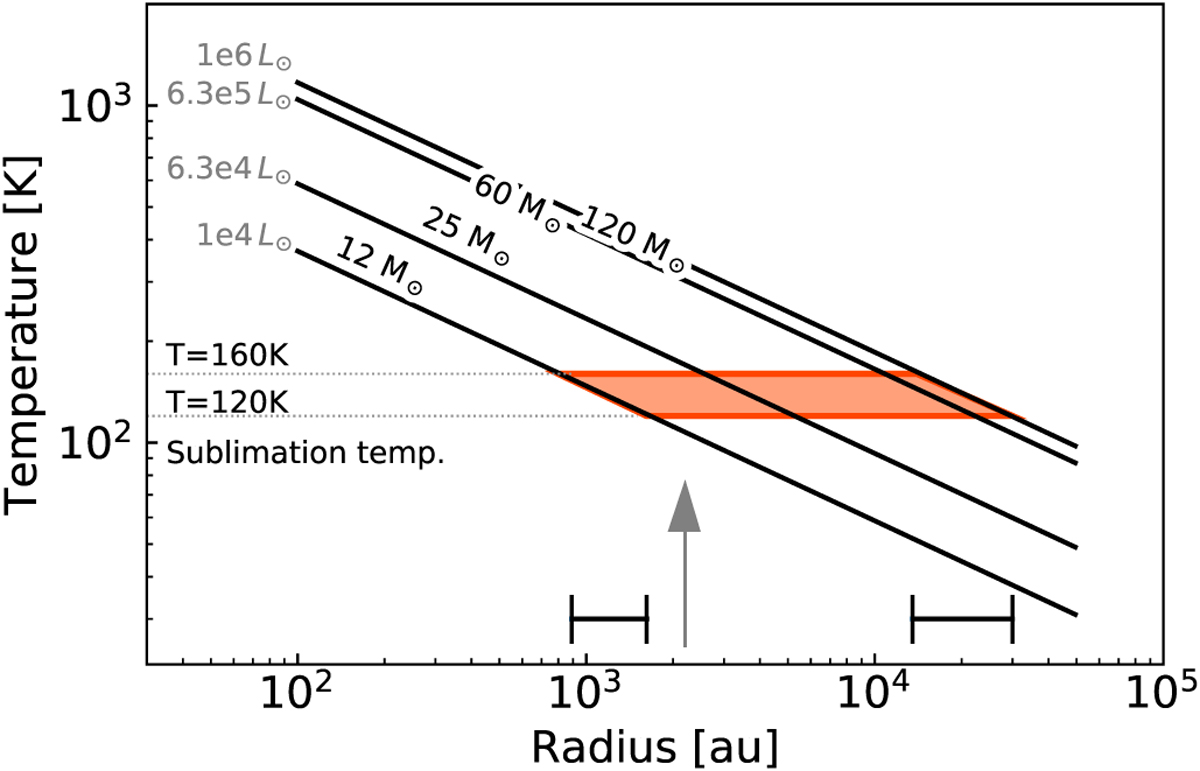
Temperature profiles as a function of radius for centrally illuminated dusty cores from 12 M⊙ to 120 M⊙, following Wilner et al. (1995). The red shaded area shows the interval that corresponds to the sublimation temperature of the ices (120–160 K). The two horizontal black lines represent the range of radii expected for a heating source with a luminosity of 104 L⊙ (12 M⊙) and 106 L⊙ (120 M⊙). The gray arrow indicates the median size of the methyl formate sources in our sample.
Current usage metrics show cumulative count of Article Views (full-text article views including HTML views, PDF and ePub downloads, according to the available data) and Abstracts Views on Vision4Press platform.
Data correspond to usage on the plateform after 2015. The current usage metrics is available 48-96 hours after online publication and is updated daily on week days.
Initial download of the metrics may take a while.