Fig. 13
Download original image
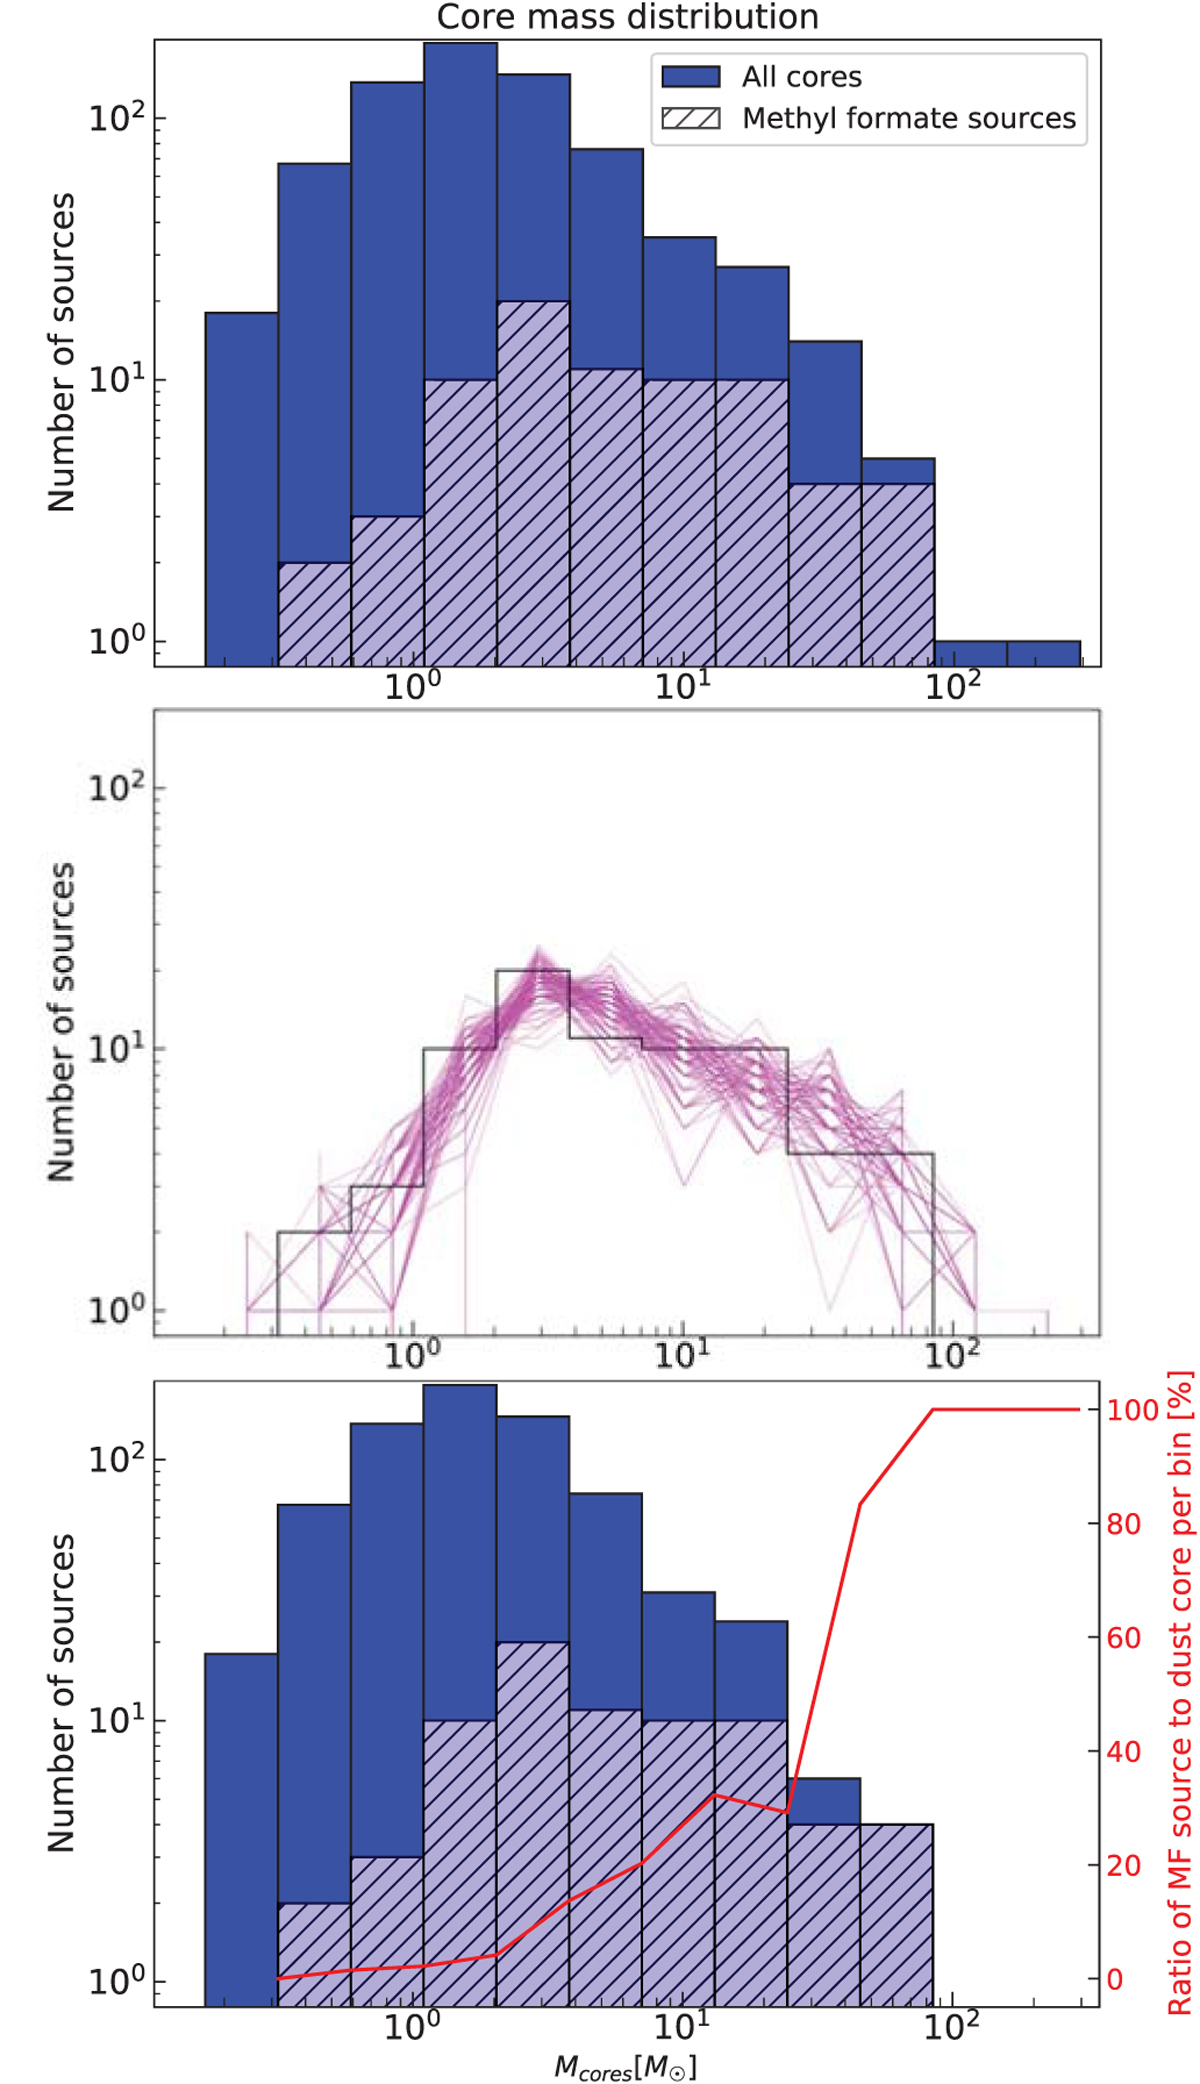
Mass distribution of the methyl formate sources (black hatched histogram) computed using Td = 100 K for all sources except the six most extreme ones, for which we used 300 K instead. The magenta lines in the middle panel show in comparison the mass distributions obtained for 100 realizations of randomly sampled temperatures between 50 and 150 K (or 200 and 400 K for the six most extreme sources). The blue histogram in the top panel shows the mass distribution of all cores, i.e., all compact dust continuum cores (without free-free contaminated sources) plus all the methyl formate sources. In the bottom panel we removed from the blue histogram 22 compact dust continuum cores for which the PPMAP method does not provide robust temperature estimates. The red line shows the ratio of methyl formate sources to the total number of cores per bin.
Current usage metrics show cumulative count of Article Views (full-text article views including HTML views, PDF and ePub downloads, according to the available data) and Abstracts Views on Vision4Press platform.
Data correspond to usage on the plateform after 2015. The current usage metrics is available 48-96 hours after online publication and is updated daily on week days.
Initial download of the metrics may take a while.