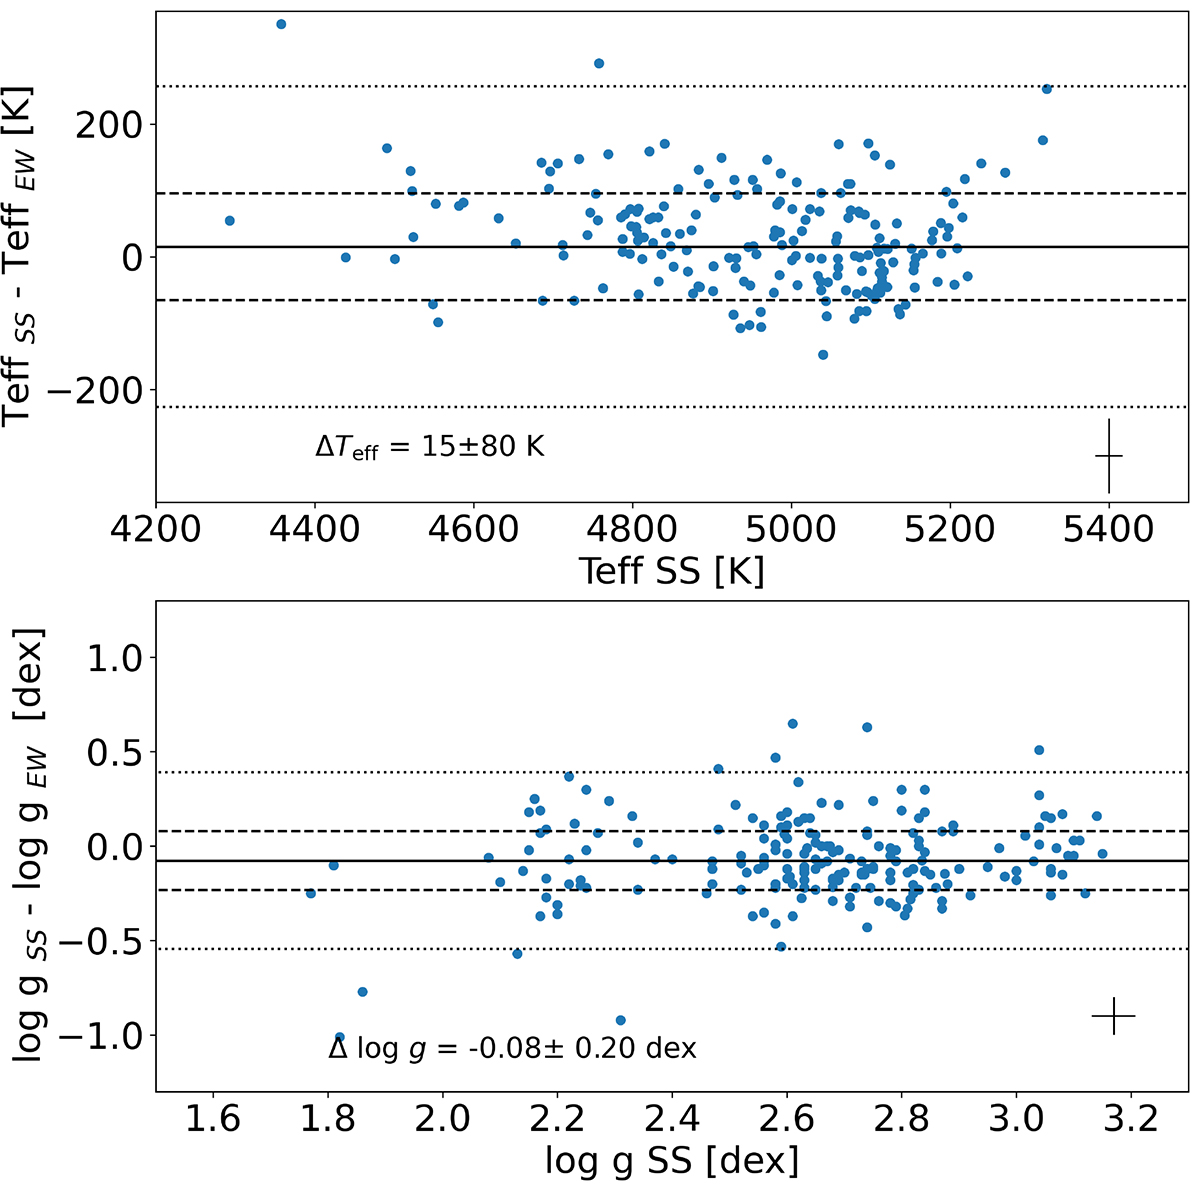
Fig. 3.
Download original image
Differences, in the sense SS-EW, of the Teff (top) and log g (bottom) as a function of the SS values. Mean difference (solid line), standard deviation (dashed lines), and 3σ levels (dotted lines), are shown in the plot. Typical error bars, calculated as the square of the quadratic sum of each method uncertainties, are shown in the bottom-right corner.
Current usage metrics show cumulative count of Article Views (full-text article views including HTML views, PDF and ePub downloads, according to the available data) and Abstracts Views on Vision4Press platform.
Data correspond to usage on the plateform after 2015. The current usage metrics is available 48-96 hours after online publication and is updated daily on week days.
Initial download of the metrics may take a while.