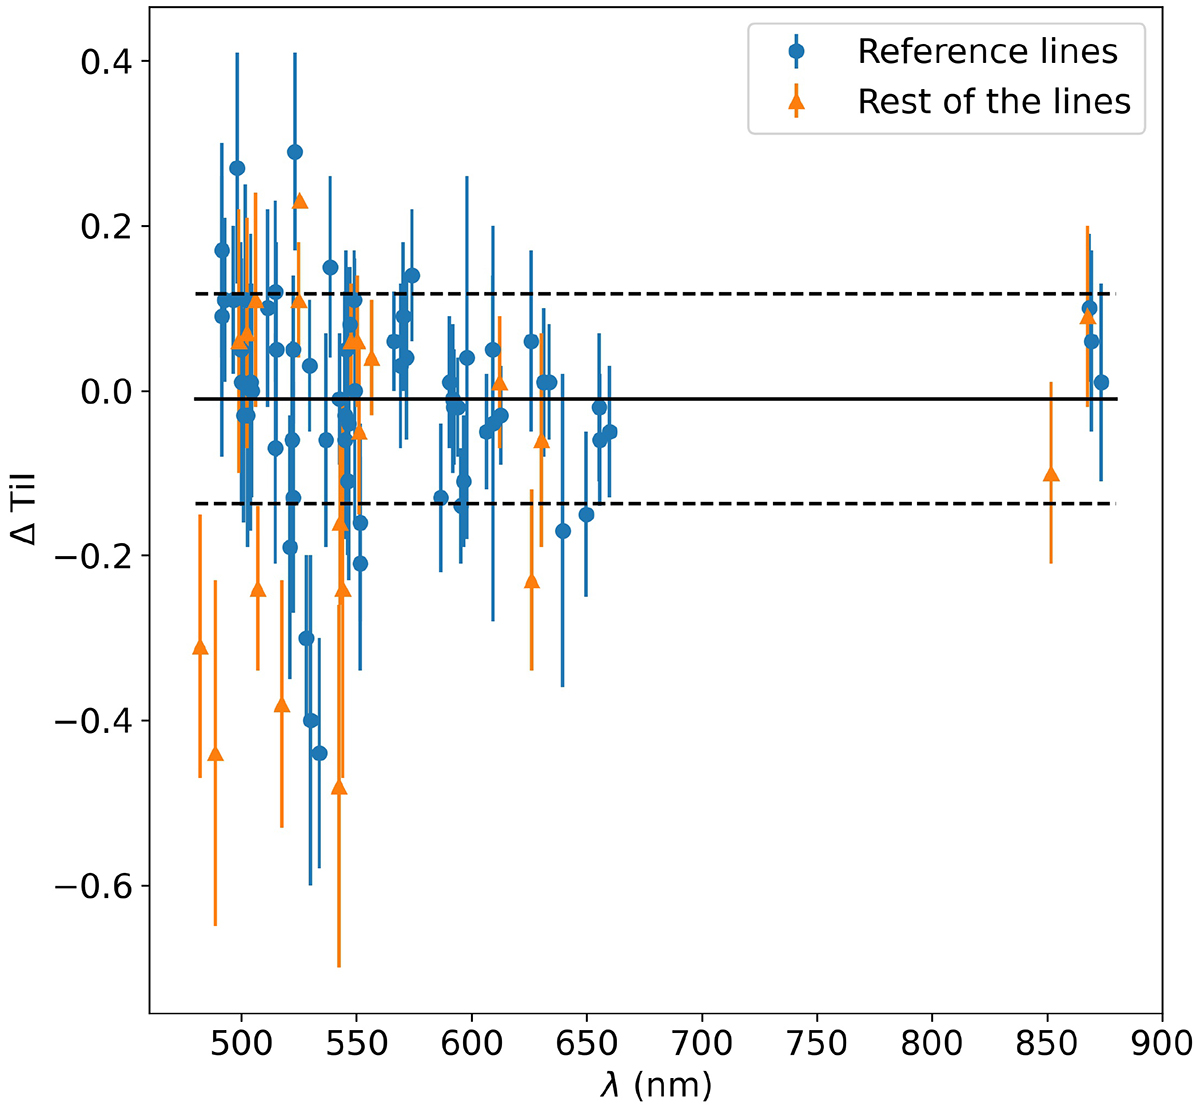
Fig. 2.
Download original image
Difference between the abundance calculated using a given line and the Ti I mean abundance represented versus the wavelength of the line. The blue circles are the reference lines, while orange triangles are the others. The distribution of the reference lines is used as selection criteria, keeping those lines that are in the region delimited by ±1σ (between dotted lines). Ti is used as an illustration; the procedure is the same for all chemical elements.
Current usage metrics show cumulative count of Article Views (full-text article views including HTML views, PDF and ePub downloads, according to the available data) and Abstracts Views on Vision4Press platform.
Data correspond to usage on the plateform after 2015. The current usage metrics is available 48-96 hours after online publication and is updated daily on week days.
Initial download of the metrics may take a while.