Fig. 18.
Download original image
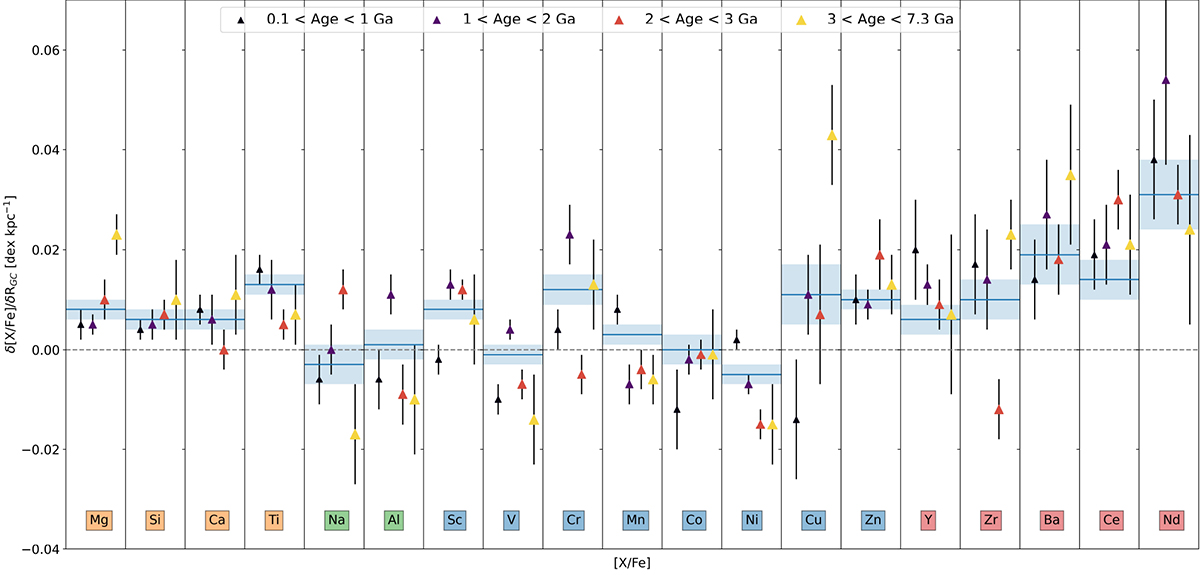
Change of OCCASO+ [X/Fe] radial gradient in four age bins, depicted by the size and the color of the markers. In each panel, age is growing towards the right. Blue horizontal lines represent the radial gradient for the whole age range, and the shadow area shows its dispersion. The table with the trends is available under request.
Current usage metrics show cumulative count of Article Views (full-text article views including HTML views, PDF and ePub downloads, according to the available data) and Abstracts Views on Vision4Press platform.
Data correspond to usage on the plateform after 2015. The current usage metrics is available 48-96 hours after online publication and is updated daily on week days.
Initial download of the metrics may take a while.