Open Access
Fig. 14.
Download original image
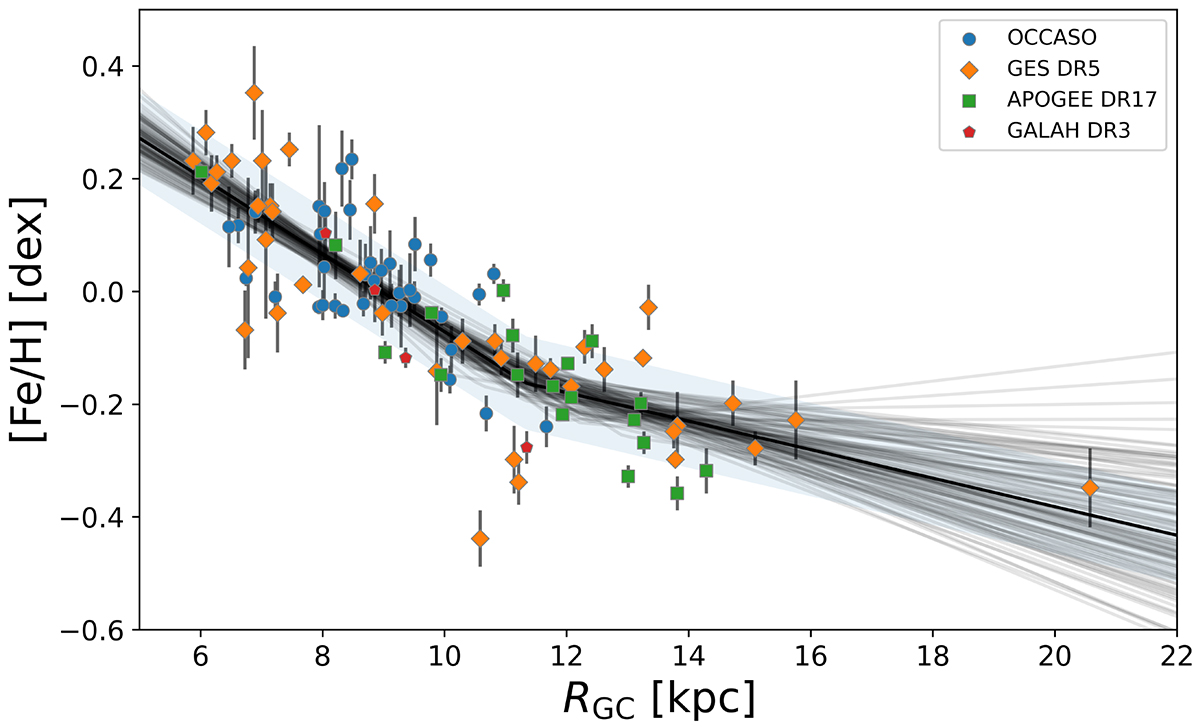
[Fe/H] versus Galactocentric radius for OCCASO+ sample. The different surveys are color-coded as in Fig. 1. The grey vertical lines represent the uncertainties of abundances, and the black line represents our best fit.
Current usage metrics show cumulative count of Article Views (full-text article views including HTML views, PDF and ePub downloads, according to the available data) and Abstracts Views on Vision4Press platform.
Data correspond to usage on the plateform after 2015. The current usage metrics is available 48-96 hours after online publication and is updated daily on week days.
Initial download of the metrics may take a while.