Fig. 4
Download original image
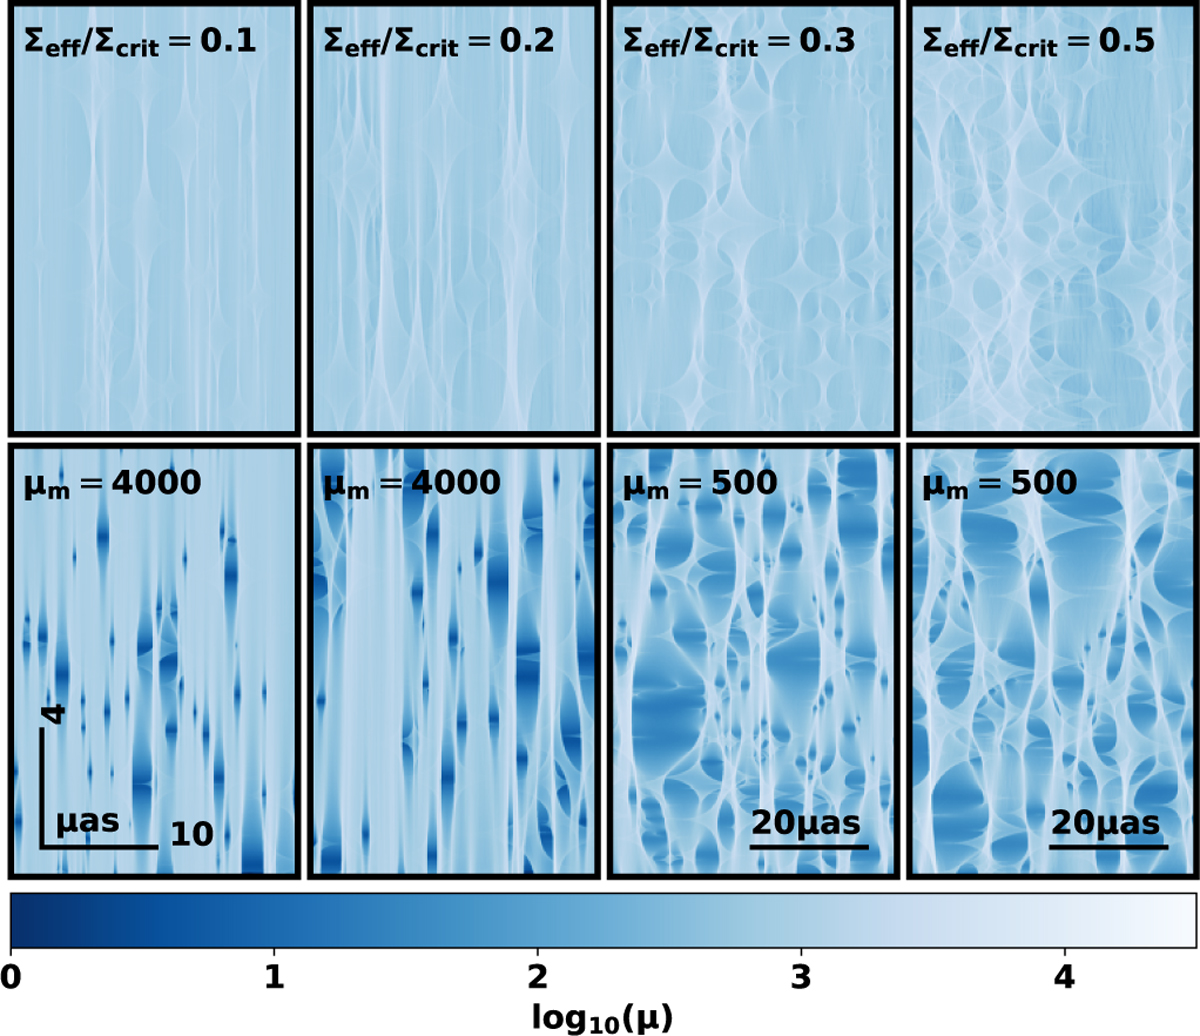
High resolution view of the magnification at the source plane. Top panels: positive parity side of the macro-CC. Bottom panels: negative parity side of the macro-CC. The effective surface mass density increases from left to right. The value of the macro magnification and the ratio of the effective surface density to the critical value are shown for each column. Note that the y-direction has been compressed a factor 10 for better visualisation. For the same reason, the two rightmost columns have been compressed a factor 2 in the x-direction.
Current usage metrics show cumulative count of Article Views (full-text article views including HTML views, PDF and ePub downloads, according to the available data) and Abstracts Views on Vision4Press platform.
Data correspond to usage on the plateform after 2015. The current usage metrics is available 48-96 hours after online publication and is updated daily on week days.
Initial download of the metrics may take a while.