Fig. B.1
Download original image
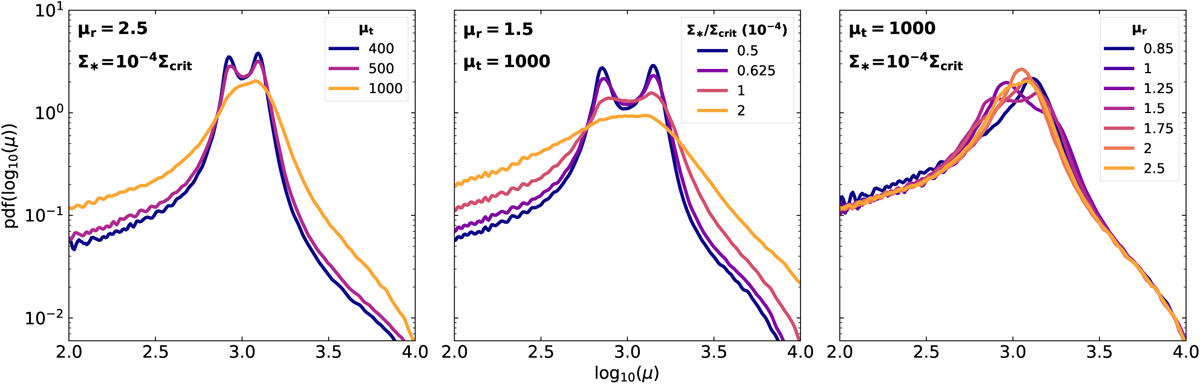
Zoom in on the magnification probability around the mode. We show the substructure of this peak and its changes as we fixed two parameters and allowed the remaining one to change. μt (left panel) controls the position of each peak, while its width is only scaled with ∑* (middle panel). The ratio of peak amplitudes depends on μr (Right panel).
Current usage metrics show cumulative count of Article Views (full-text article views including HTML views, PDF and ePub downloads, according to the available data) and Abstracts Views on Vision4Press platform.
Data correspond to usage on the plateform after 2015. The current usage metrics is available 48-96 hours after online publication and is updated daily on week days.
Initial download of the metrics may take a while.