Fig. 2
Download original image
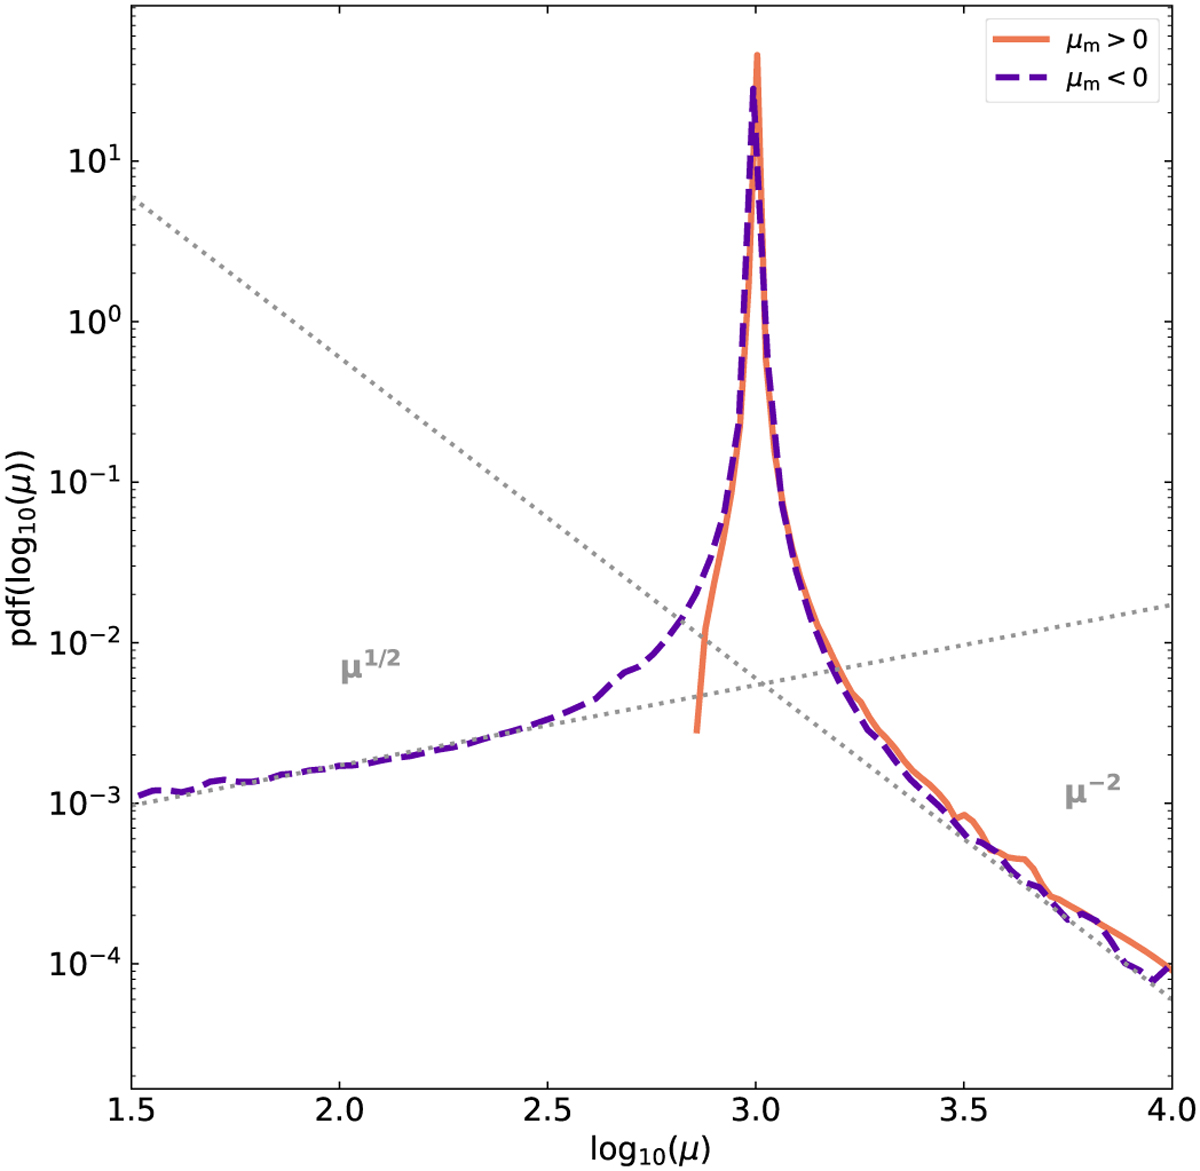
Probability of magnification (in log10 bins) for the two single lenses. The purple dashed line represents the microlens on the negative parity side of the macro-CC, while the orange solid line represents the positive parity case on the right and left panels of Fig. 1, respectively. The dotted lines represents the power-laws that always appear for isolated microlenses near macro-CCs, and for N microlenses with low ∑eff. The variation in the value of the ∑−2 power-law amplitude is shown in Fig. 3.
Current usage metrics show cumulative count of Article Views (full-text article views including HTML views, PDF and ePub downloads, according to the available data) and Abstracts Views on Vision4Press platform.
Data correspond to usage on the plateform after 2015. The current usage metrics is available 48-96 hours after online publication and is updated daily on week days.
Initial download of the metrics may take a while.