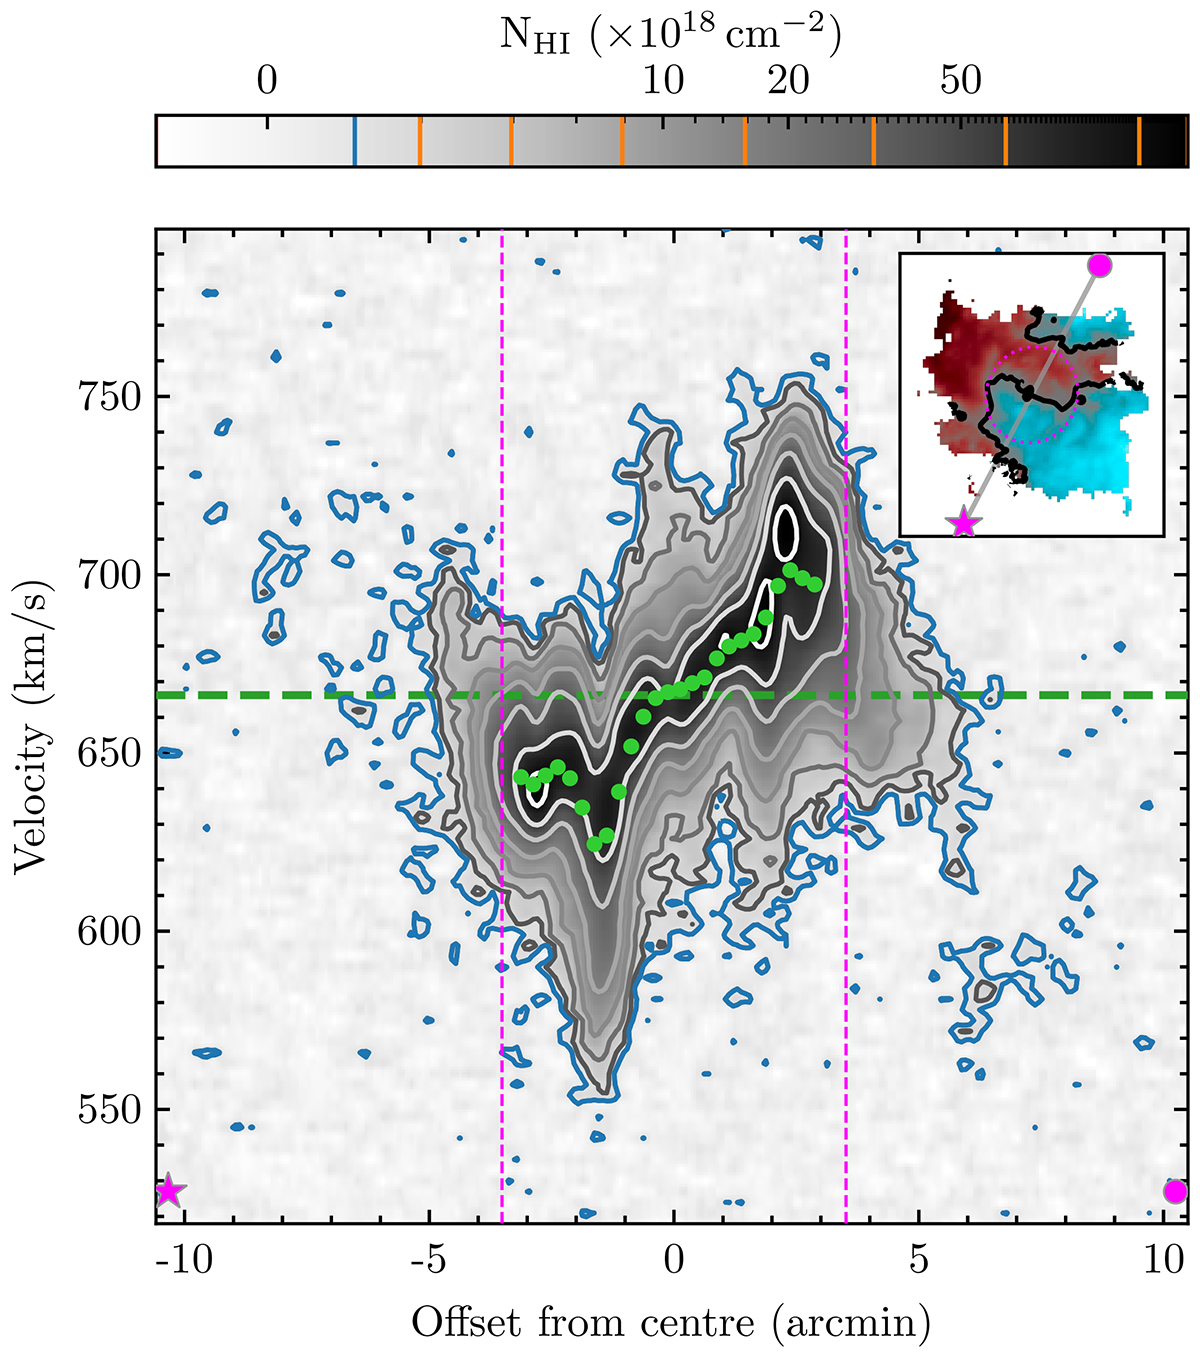
Fig. 7.
Download original image
Position-velocity diagram extracted with a width of 21.6″ which corresponds to the size of the beam. The slice is extracted along optical major axis. The inset on the top right of the figure shows the velocity field from Fig. 6, the grey line running from the magenta star to the filled circle represent the path along which the PV slice was extracted, the magenta star and circle are located in the lower left and upper right corners indicating the direction of the slice, these symbols are repeated lower left and right corners of the main figure. The horizontal dashed green line indicates the systemic velocity, while the light green filled circles show the moment 1 velocity at each position along the major axis. The dashed vertical magenta lines correspond to the edge of the optical disk represented by the dotted magenta ellipse in the inset. The blue and orange contours in the colour bar correspond to the blue and greyscale contours on the PV slice.
Current usage metrics show cumulative count of Article Views (full-text article views including HTML views, PDF and ePub downloads, according to the available data) and Abstracts Views on Vision4Press platform.
Data correspond to usage on the plateform after 2015. The current usage metrics is available 48-96 hours after online publication and is updated daily on week days.
Initial download of the metrics may take a while.