Fig. 4.
Download original image
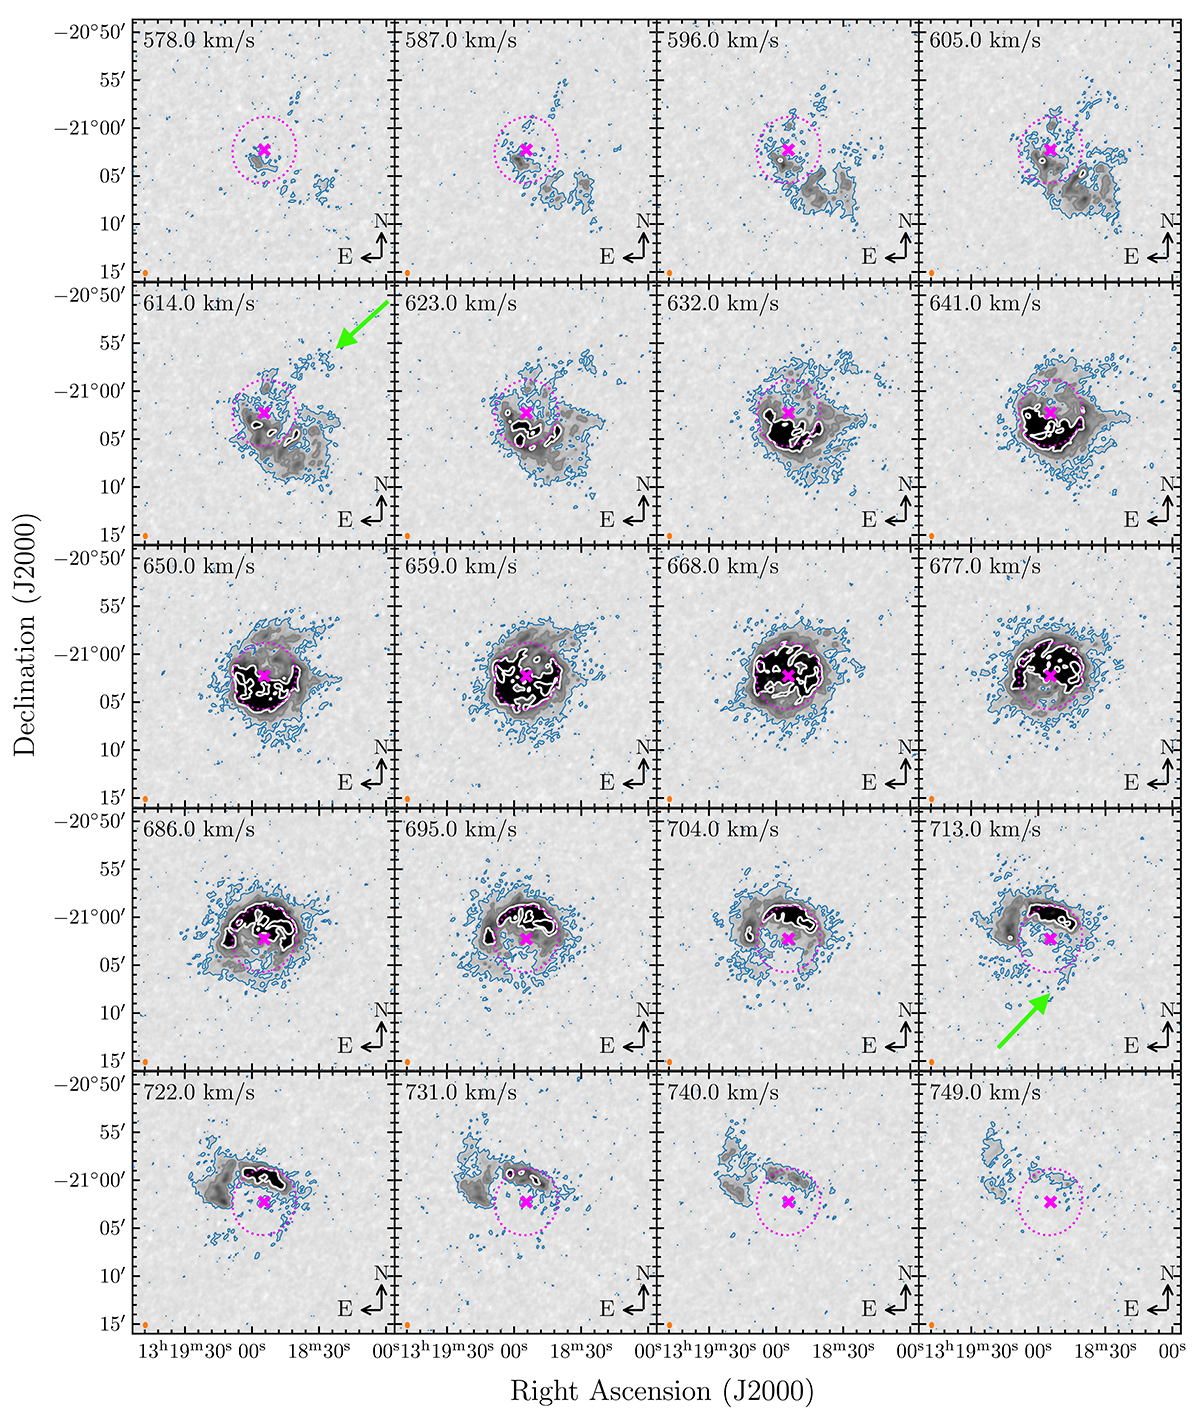
Channel maps taken from the r10_t0 cube that has been smoothed with a 5 channel Hanning window and regridded to 3 km s−1 channels. Every third 3 km s−1 channel for a 170 km s−1 range centred on the systemic velocity is shown. The blue contour indicates 3σrms, the greyscale contours are 3σrms × 2n, n = 2, 4, 6, ⋯. The magenta cross indicates the optical centre of the galaxy, and dotted magenta ellipse indicates the extent of the optical disk (D25) of the galaxy. The green arrows point to “fingers” in the H I. The orange ellipse in the lower left corner of each panel represents the 21.6″ beam.
Current usage metrics show cumulative count of Article Views (full-text article views including HTML views, PDF and ePub downloads, according to the available data) and Abstracts Views on Vision4Press platform.
Data correspond to usage on the plateform after 2015. The current usage metrics is available 48-96 hours after online publication and is updated daily on week days.
Initial download of the metrics may take a while.