Fig. 3.
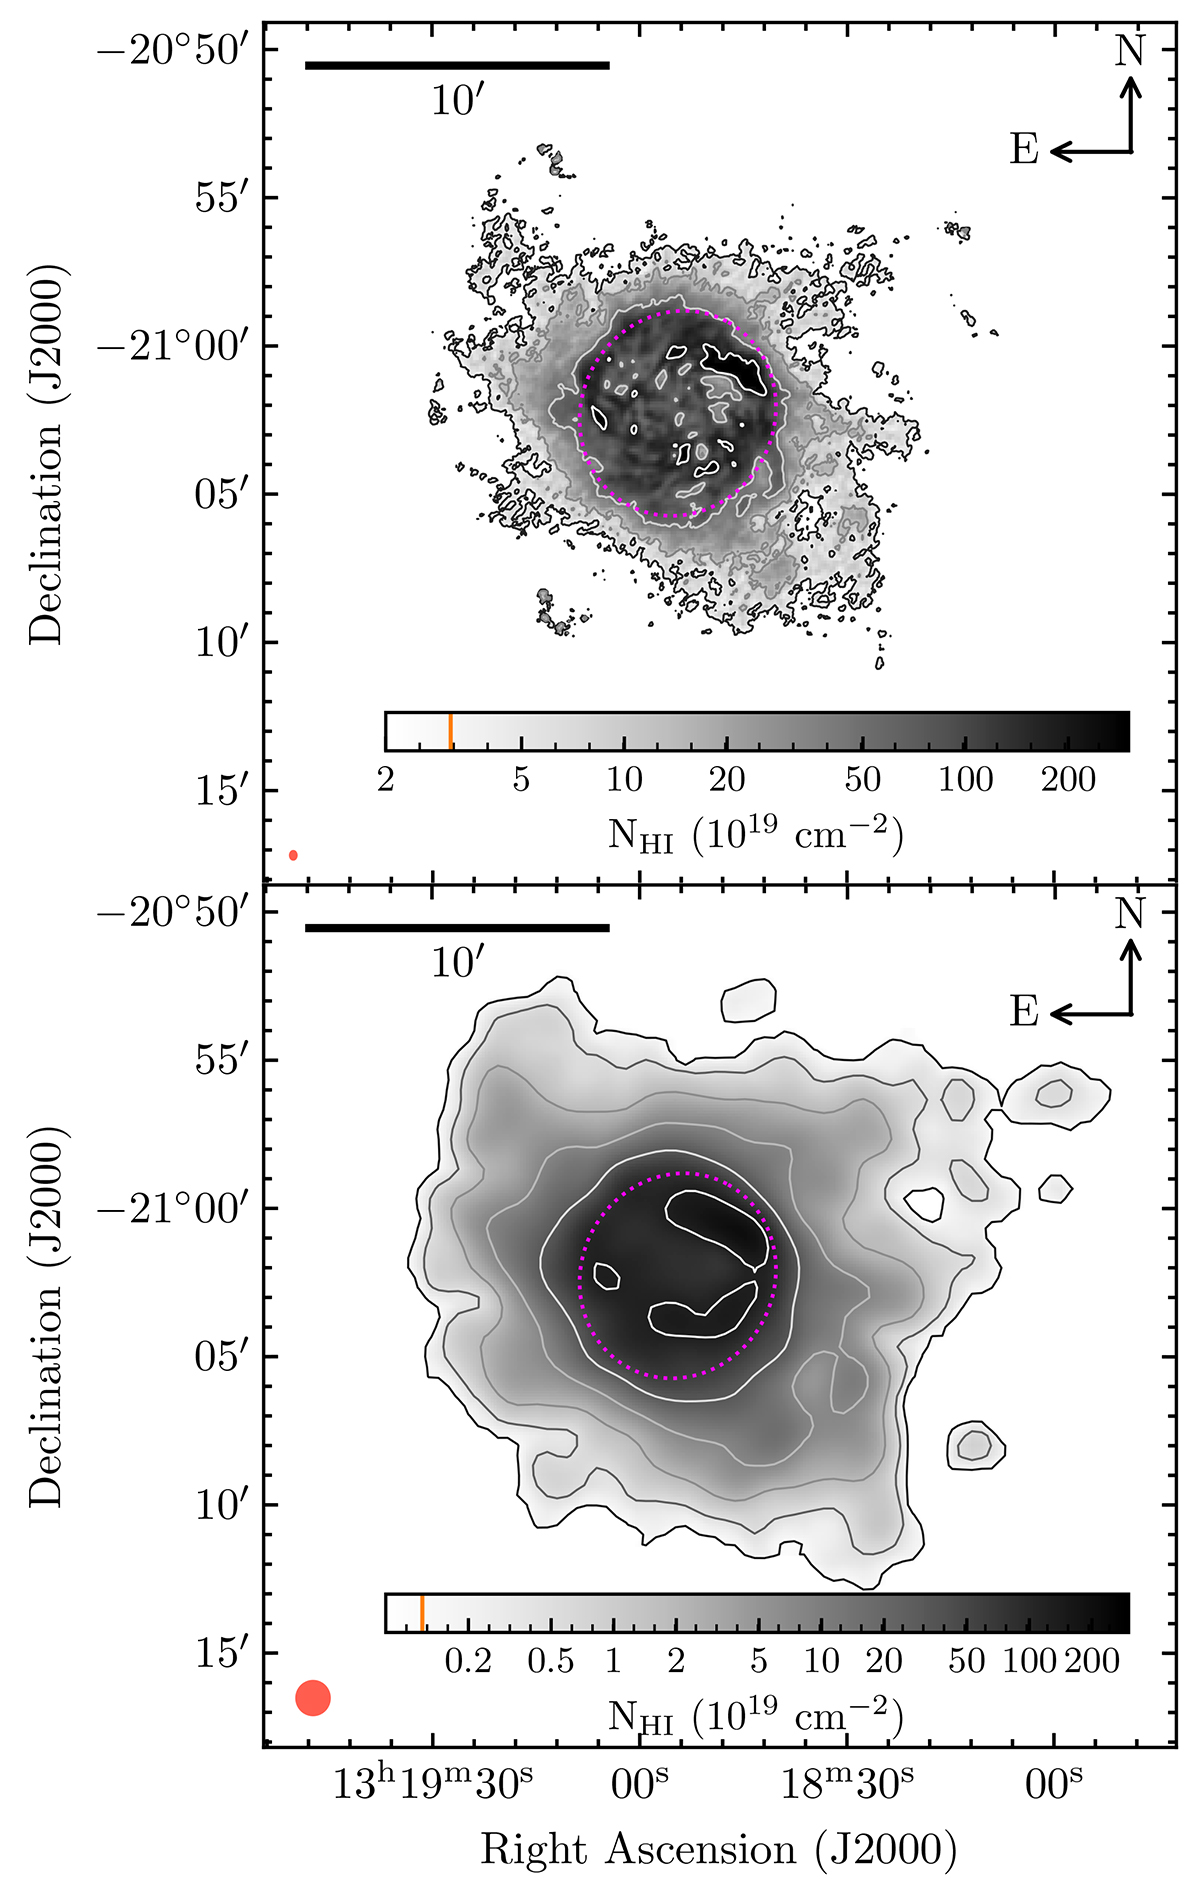
Download original image
Integrated intensity (moment 0) maps of NGC 5068. In the top panel is the map from one of the high resolution cubes (r05_t0) at 11″, and in the bottom panel is a map from one of the low resolution cubes (r05_t60) at 64″. The dashed magenta ellipse is centred on the optical centre of the galaxy and represents the extent of the optical disk. The contours increase as σS/N = 3 × 2n, n = 0, 2, 4, 6, ⋯. The lowest contour plotted is the S/N = 3 contour, NH I = 3.1 × 1019 cm−2 for the top panel and NH I = 1.1 × 1018 cm−2 for the bottom panel, these S/N = 3 (n = 0) values are indicated on the respective colour bars by the orange line. The red ellipse in the bottom left corner of each panel represents the beam.
Current usage metrics show cumulative count of Article Views (full-text article views including HTML views, PDF and ePub downloads, according to the available data) and Abstracts Views on Vision4Press platform.
Data correspond to usage on the plateform after 2015. The current usage metrics is available 48-96 hours after online publication and is updated daily on week days.
Initial download of the metrics may take a while.