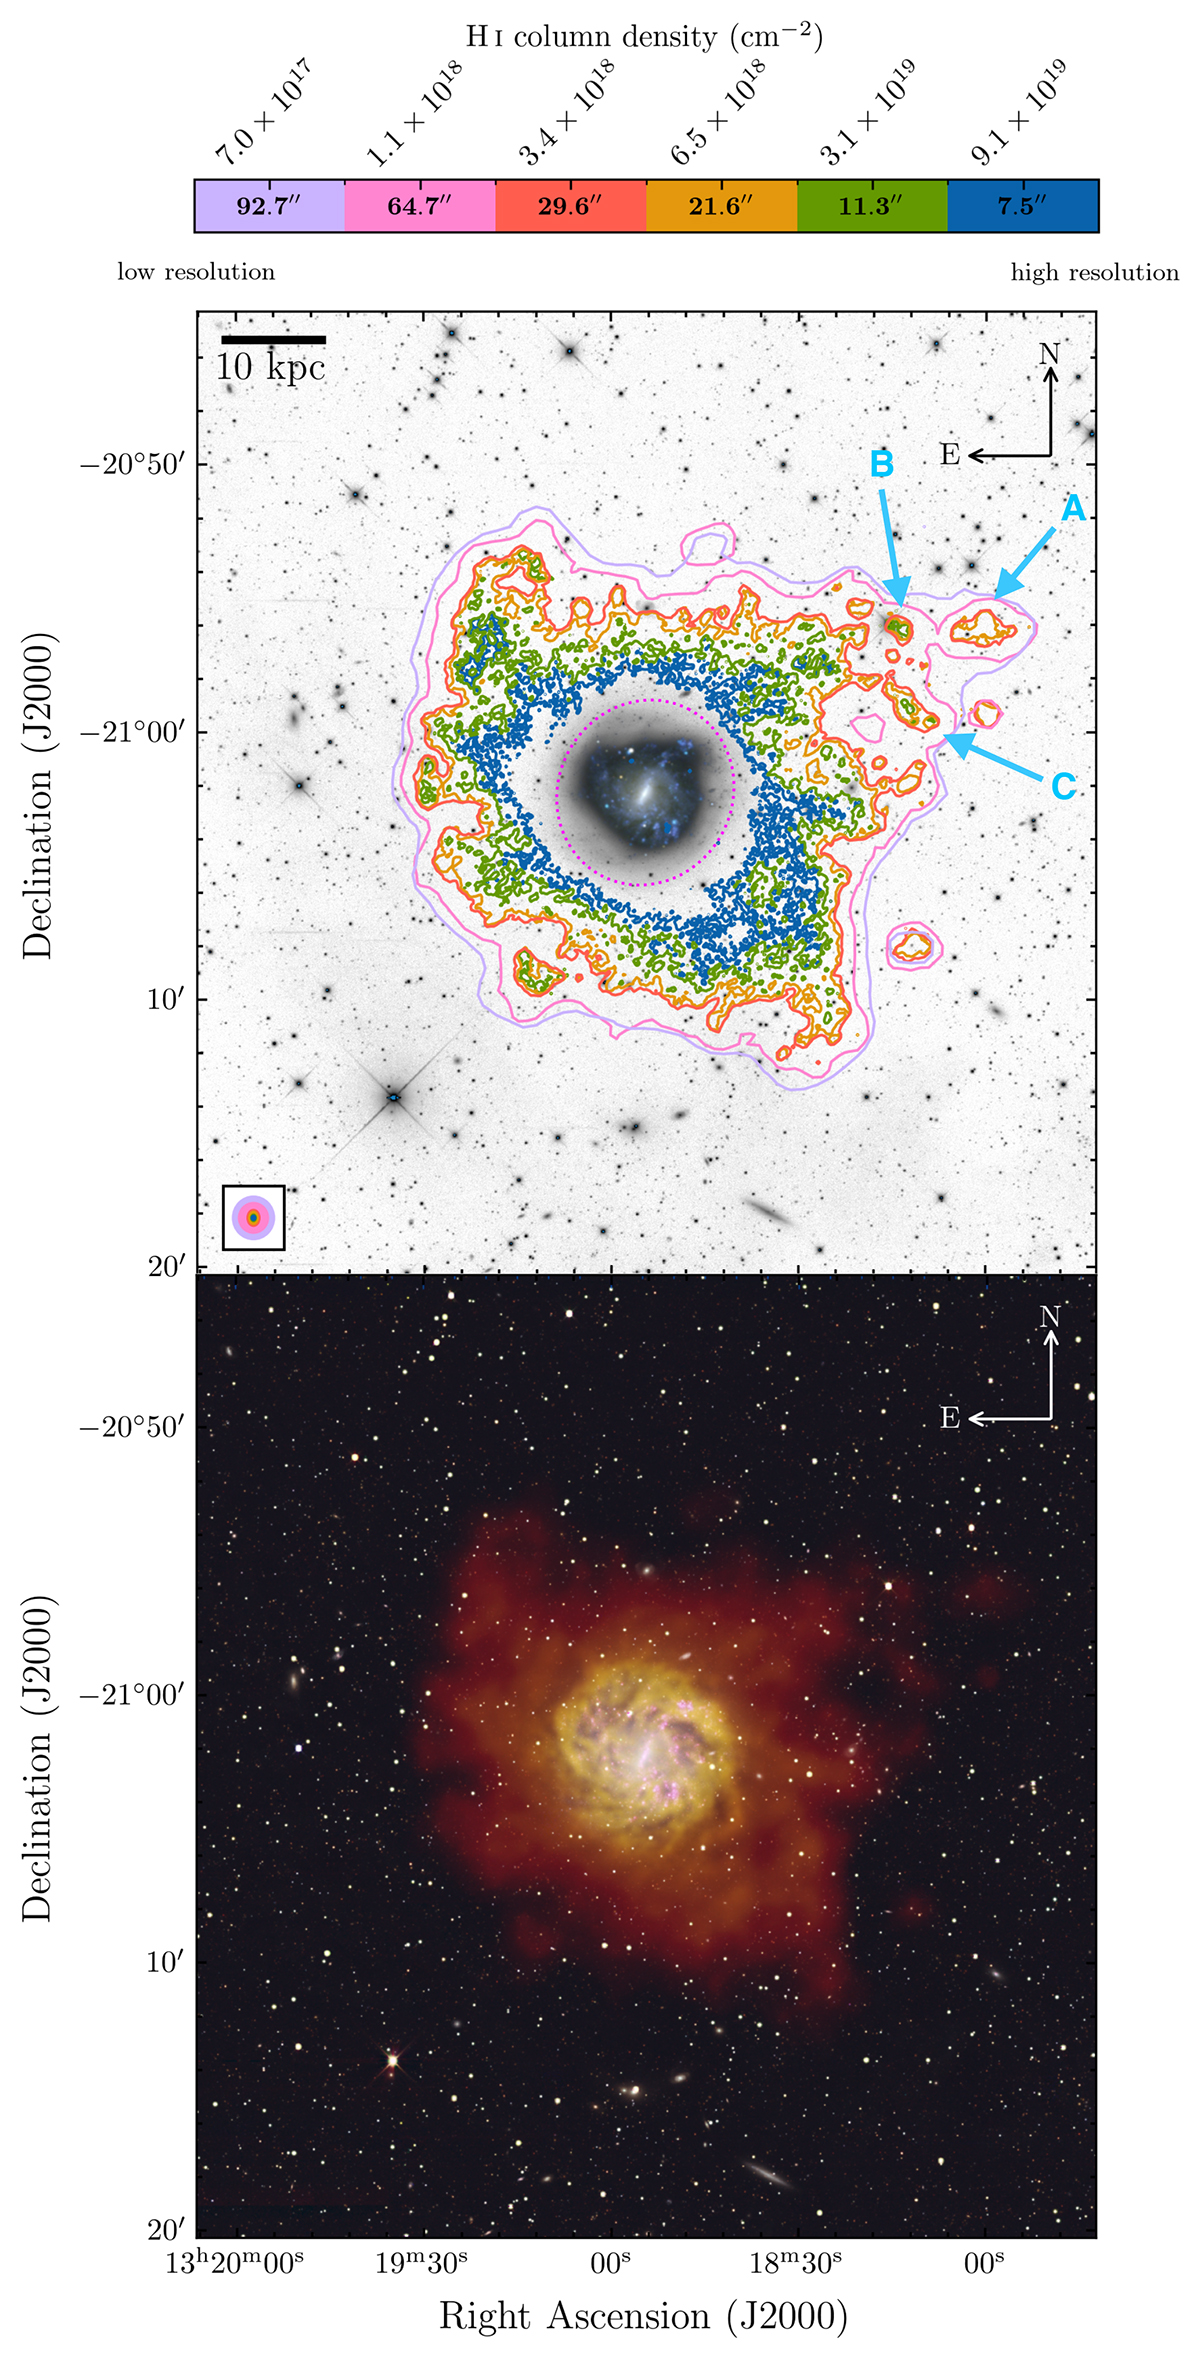
Fig. 2.
Download original image
Overview of the optical and H I emission of NGC 5068. Top: greyscale MeerLICHT q-band image and colour with contours from the six different resolution H I cubes. The contours correspond to colours in the colourbar which indicate the resolution and the H I column density at the S/N = 3 contour in the intensity maps. Three clouds associated with the galaxy are labelled A, B, C. Dotted magenta ellipse indicates the optical extent of the galaxy. The beam for resolution (contour) is shown in the corresponding colour in the box in the bottom left corner. Bottom: H I emission combined with Fig. 1. The red, orange, and yellow show moment 0 maps of the H I emission from the 64.7″ (r05_t60), 29.6″ (r10_t00), and 7.5″ (r00_t00) resolution H I cubes respectively. Production of this image followed English (2017), including the technique of masking in order to combine the data sets and reveal the optical data’s H II regions (light pink).
Current usage metrics show cumulative count of Article Views (full-text article views including HTML views, PDF and ePub downloads, according to the available data) and Abstracts Views on Vision4Press platform.
Data correspond to usage on the plateform after 2015. The current usage metrics is available 48-96 hours after online publication and is updated daily on week days.
Initial download of the metrics may take a while.