Fig. 10.
Download original image
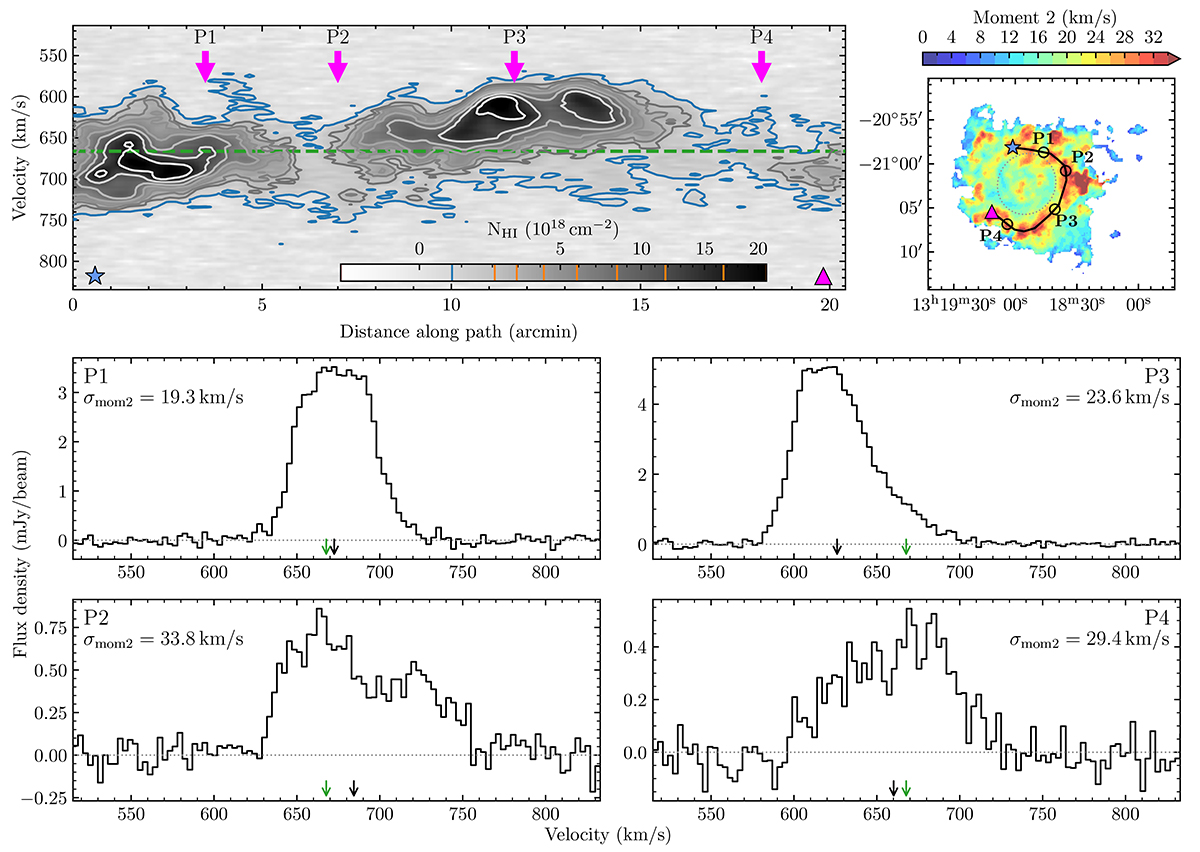
Top left: position-velocity (PV) diagram through the high moment 2 region of NGC 5068. The blue and orange lines in the greyscale colourbar correspond to the blue and greyscale contours. The green dashed line indicates the systemic velocity. Top right: moment 2 map of the galaxy with the black line tracing the path along which the PV slice was extracted, starting from the blue star and ending at the magenta triangle. Bottom: H I line profiles extracted at different locations along the PV slice, the extracted locations are indicated by the magenta arrows in the PV diagram. The location of each spectrum is also indicated by the labelled open circles on the moment 2 map. Green arrows at the bottom of the line profiles indicate the systemic velocity of the galaxy, while the black arrows point to the moment 1 velocity.
Current usage metrics show cumulative count of Article Views (full-text article views including HTML views, PDF and ePub downloads, according to the available data) and Abstracts Views on Vision4Press platform.
Data correspond to usage on the plateform after 2015. The current usage metrics is available 48-96 hours after online publication and is updated daily on week days.
Initial download of the metrics may take a while.