Open Access
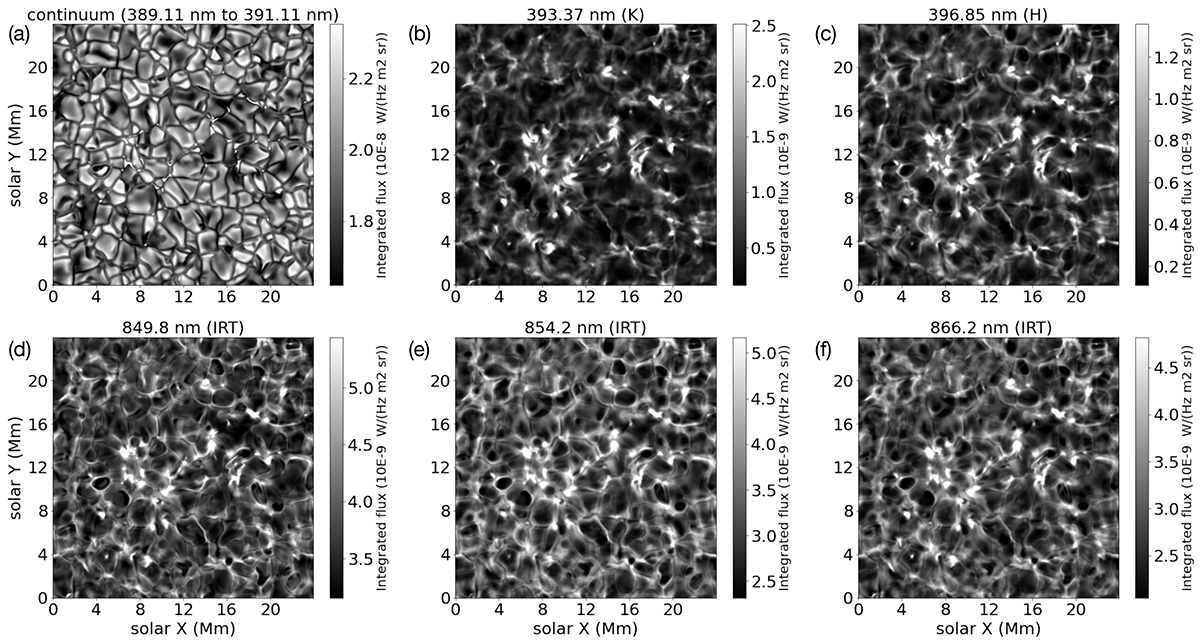
Fig. 4.
Download original image
Maps showing the integrated intensities, within the 1st and 99th percentile, for the wavelength ranges of interest for the calculation of the s index and the IRT index, namely, the continuum, triangular bandpasses of 2 Å centred at lines K and H, and rectangular bandpasses of 2 Å around lines in the infrared triplet.
Current usage metrics show cumulative count of Article Views (full-text article views including HTML views, PDF and ePub downloads, according to the available data) and Abstracts Views on Vision4Press platform.
Data correspond to usage on the plateform after 2015. The current usage metrics is available 48-96 hours after online publication and is updated daily on week days.
Initial download of the metrics may take a while.