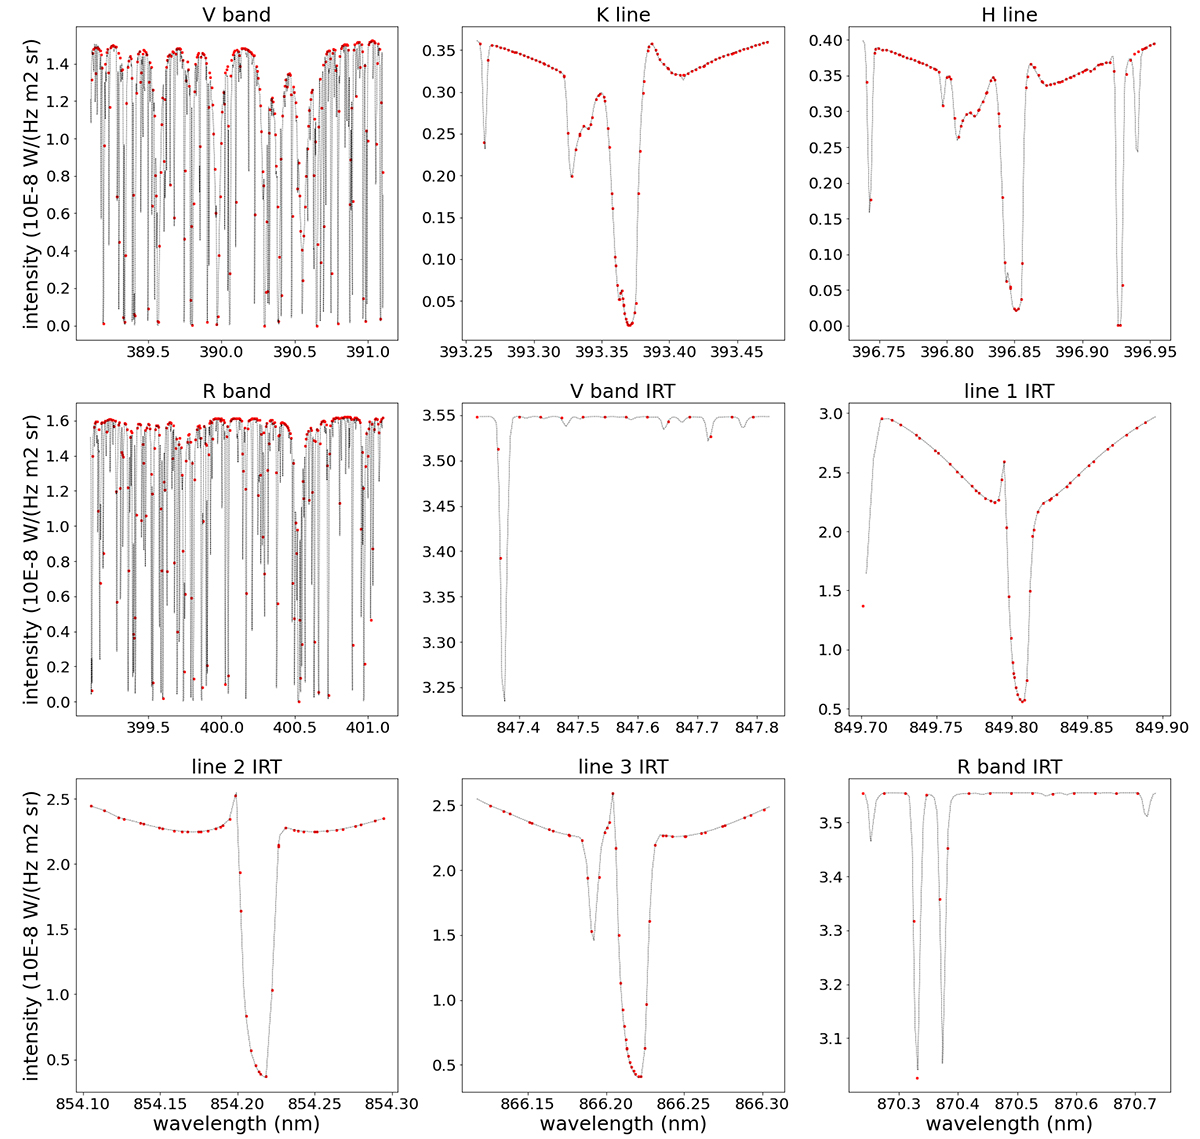
Fig. 3.
Download original image
Same legend as in Fig. 2, for the bands of interest for the calculation of the s index and IRT index. The panels show these bands: V band (389.1067 nm–391.1067 nm), K line (393.3664 nm), H line (396.847 nm), R band (399.1067 nm–401.1067 nm), V band for IRT (847.33 nm–847.83 nm), 1st triplet line (849.8 nm), 2nd triplet line (854.2 nm), 3rd triplet line (8662 nm), and R band for IRT (870.24 nm to 870.74 nm).
Current usage metrics show cumulative count of Article Views (full-text article views including HTML views, PDF and ePub downloads, according to the available data) and Abstracts Views on Vision4Press platform.
Data correspond to usage on the plateform after 2015. The current usage metrics is available 48-96 hours after online publication and is updated daily on week days.
Initial download of the metrics may take a while.